Hyundai 2005 Annual Report Download - page 34
Download and view the complete annual report
Please find page 34 of the 2005 Hyundai annual report below. You can navigate through the pages in the report by either clicking on the pages listed below, or by using the keyword search tool below to find specific information within the annual report.-
 1
1 -
2
-
3
-
4
-
5
-
6
-
7
-
8
-
9
-
10
-
11
-
12
-
13
-
14
-
15
-
16
-
17
-
18
-
19
-
20
-
21
-
22
-
23
-
 24
24 -
 25
25 -
 26
26 -
 27
27 -
 28
28 -
 29
29 -
 30
30 -
 31
31 -
 32
32 -
 33
33 -
 34
34 -
 35
35 -
 36
36 -
 37
37 -
 38
38 -
 39
39 -
 40
40 -
 41
41 -
 42
42 -
 43
43 -
 44
44 -
45
-
46
-
47
-
48
-
49
-
50
-
51
-
52
-
53
-
54
-
55
-
56
-
57
-
58
-
59
-
60
-
61
-
62
-
63
 |
 |

66
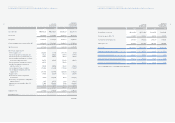
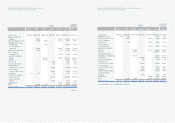
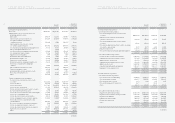
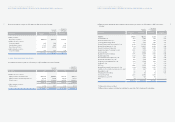
HYUNDAI MOTOR COMPANY AND SUBSIDIARIES
CONSOLIDATED STATEMENTS OF CASH FLOWS (CONTINUED) FOR THE YEARS ENDED DECEMBER 31, 2005 AND 2004
2005 2004 2005 2004
Cash flows from investing activities:
Cash inflows from investing activities:
Proceeds from disposal of short-term investment
securities ₩4,621,951 ₩6,130,563 $4,562,636 $6,051,888
Reduction in short-term financial instruments
and other current assets 1,926,638 355,002 1,901,913 350,446
Proceeds from disposal of long-term investment
securities 995,006 815,601 982,237 805,134
Proceeds from disposal of investment securities accounted
for using the equity method 67,690 43,397 66,821 42,840
Reduction in other assets 2,123,166 445,011 2,095,919 439,300
Proceeds from disposal of property, plant and equipment 210,053 243,104 207,357 239,984
9,944,504 8,032,678 9,816,883 7,929,592
Cash outflows from investing activities:
Purchase of short-term financial instruments (4,837,001) (1,660,920) (4,774,926) (1,639,605)
Acquisition of short-term investment securities (337,822) (6,216,350) (333,487) (6,136,575)
Additions to other current assets (129,517) (148,663) (127,855) (146,755)
Acquisition of long-term investment securities (672,992) (1,462,683) (664,355) (1,443,912)
Additions to other assets (6,528,384) (1,715,051) (6,444,604) (1,693,041)
Acquisition of property, plant and equipment (3,892,069) (3,412,036) (3,842,121) (3,368,249)
Expenditures for development costs (858,864) (657,511) (847,842) (649,073)
(17,256,649) (15,273,214) (17,035,190) (15,077,210)
(7,312,145) (7,240,536) (7,218,307) (7,147,618)
Cash flows from financing activities: . .
Cash inflows from financing activities:
Proceeds from short-term borrowings 23,583,562 29,802,633 23,280,911 29,420,171
Proceeds from long-term debt 6,834,217 5,841,587 6,746,512 5,766,621
Proceeds from issuance of stock 6,413 6,404 6,331 6,322
Proceeds from disposal of treasury stock 53,617 - 52,929 -
Others 853,372 433,209 842,421 427,650
31,331,181 36,083,833 30,929,104 35,620,764
Cash outflows from financing activities:
Repayment of short-term borrowings (21,720,920) (28,657,473) (21,442,172) (28,289,707)
Payment of current maturities of long-term debt (3,696,695) (5,595,553) (3,649,255) (5,523,744)
Payment of cash dividends (404,080) (285,674) (398,894) (282,008)
Repayment of long-term debt (850,353) (397,346) (839,440) (392,247)
Purchase of treasury stock (660,654) (209,268) (652,176) (206,582)
Others (115,479) (508,549) (113,998) (502,024)
(27,448,181) (35,653,863) (27,095,935) (35,196,312)
3,883,000 429,970 3,833,169 424,452
(continued)
Korean Won
(In millions)
Translation into
U.S. Dollars (Note 2)
(In thousands)
65
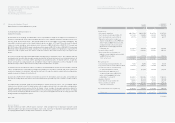
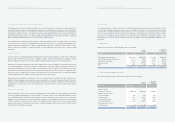
HYUNDAI MOTOR COMPANY AND SUBSIDIARIES
CONSOLIDATED STATEMENTS OF CASH FLOWS FOR THE YEARS ENDED DECEMBER 31, 2005 AND 2004
2005 2004 2005 2004
Cash flows from operating activities:
Net income ₩2,323,816 ₩1,641,941 $2,293,994 $1,620,871
Adjustments to reconcile net income to net cash
provided by operating activities:
Depreciation 2,085,629 1,622,192 2,058,864 1,601,375
Gain on foreign currency translation, net (200,227) (201,308) (197,657) (198,725)
Loss (gain) on disposal of investments
and other assets, net (158,298) 15,884 (156,267) 15,680
Gain on valuation of investments accounted
for using the equity method, net (538,773) (284,264) (531,859) (280,616)
Loss on disposal of property, plant and equipment, net 261,612 137,193 258,255 135,432
Gain on redemption of debentures, net - (3,144) - (3,104)
Loss (reversal of loss) on impairment of investments (57,835) 232,476 (57,093) 229,493
Loss on disposal of trade receivables 173,744 114,365 171,514 112,897
Impairment loss on intangibles 7,859 472,906 7,758 466,837
Amortization of discount on debentures 26,815 38,294 26,471 37,803
Amortization of intangibles, net 413,240 387,433 407,937 382,461
Provision for severance benefits 616,320 558,188 608,411 551,025
Provision for warranties and product liabilities, net 634,214 872,706 626,075 861,506
Reversal of accrued warranties and product
liabilities (2,866) (305,765) (2,829) (301,841)
Gain on valuation of investment securities (180,737) - (178,418) -
Provision for doubtful accounts 633,394 934,865 625,266 922,868
Amortization of present value discount accounts 10,865 - 10,726 -
Net income on minority interests 495,785 176,103 489,423 173,843
Others (249,276) 274,250 (246,077) 270,731
Changes in operating assets and liabilities:
Decrease (increase) in trade notes and accounts
receivable (1,424,044) 129,784 (1,405,769) 128,118
Increase in advances (176,626) (51,189) (174,359) (50,532)
Increase in inventories (1,217,301) (1,341,159) (1,201,679) (1,323,948)
Increase in other current assets (53,160) (537,866) (52,478) (530,963)
Increase in long-term notes and accounts receivables (554) - (547) -
Decrease in deferred income tax assets 52,935 146,981 52,256 145,095
Increase (decrease) in trade notes and accounts payable (37,992) 815,166 (37,504) 804,705
Increase in accounts payable-other 1,648,925 200,316 1,627,764 197,745
Increase (decrease) in other current liabilities 405,165 (298,882) 399,965 (295,046)
Increase in individual severance insurance deposits (103,594) (69,580) (102,265) (68,687)
Increase (decrease) in accrued warranties and
product liabilities (500,339) 163,314 (493,918) 161,218
Decrease in accrued loss on valuation of derivatives (565) (152,035) (558) (150,084)
Increase in cumulative translation credits, net 7,692 - 7,593 -
Increase (decrease) in deferred income tax liabilities (56,777) 124,962 (56,048) 123,358
Payment of severance benefits (423,551) (538,361) (418,115) (531,452)
Others 20,261 67,495 20,001 66,628
4,435,756 5,343,261 4,378,833 5,274,691
(continued)
Korean Won
(In millions)
Translation into
U.S. Dollars (Note 2)
(In thousands)