Hyundai 2005 Annual Report Download - page 41
Download and view the complete annual report
Please find page 41 of the 2005 Hyundai annual report below. You can navigate through the pages in the report by either clicking on the pages listed below, or by using the keyword search tool below to find specific information within the annual report.-
 1
1 -
2
-
3
-
4
-
5
-
6
-
7
-
8
-
9
-
10
-
11
-
12
-
13
-
14
-
15
-
16
-
17
-
18
-
19
-
20
-
21
-
22
-
23
-
24
-
25
-
26
-
27
-
28
-
29
-
30
-
 31
31 -
 32
32 -
 33
33 -
 34
34 -
 35
35 -
 36
36 -
 37
37 -
 38
38 -
 39
39 -
 40
40 -
 41
41 -
 42
42 -
 43
43 -
 44
44 -
 45
45 -
 46
46 -
 47
47 -
 48
48 -
 49
49 -
 50
50 -
 51
51 -
52
-
53
-
54
-
55
-
56
-
57
-
58
-
59
-
60
-
61
-
62
-
63
 |
 |

80
HYUNDAI MOTOR COMPANY AND SUBSIDIARIES
NOTES TO CONSOLIDATED FINANCIAL STATEMENTS FOR THE YEARS ENDED DECEMBER 31, 2005 AND 2004
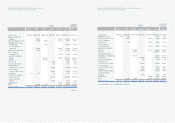
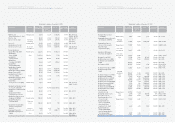
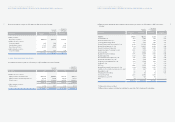
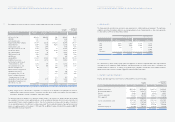
Accounts 2005 2004 2005 2004
Finished goods and merchandise ₩4,653,727 ₩4,297,037 $4,594,005 $4,241,892
Semi finished goods and work in process 980,670 794,303 968,085 784,110
Raw materials and supplies 1,189,029 866,274 1,173,770 855,157
Materials in transit 1,121,303 976,921 1,106,913 964,384
Other 31,994 6,007 31,583 5,930
₩7,976,723 ₩6,940,542 $7,874,356 $6,851,473
Korean Won
(In millions)
Translation into
U.S. Dollars (Note 2)
(In thousands)
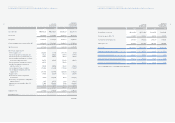
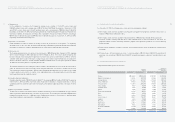
4. SHORT-TERM INVESTMENT SECURITIES:
Short-term investment securities as of December 31, 2005 consist of the following:
Description Acquisition Book value Book value
cost
Trading securities:
Beneficiary certificates ₩153,509 ₩154,831 $152,844
Available-for-sale securities:
Government bonds 2,087 2,090 2,063
Corporate bonds 341,942 341,942 337,554
Asset backed securities 5,790 5,804 5,730
Beneficiary certificates 337,022 348,877 344,400
Held-to-maturity securities:
Corporate bonds 6,249 6,230 6,149
₩846,599 ₩859,774 $848,740
Korean Won
(In millions)
Translation into
U.S. Dollars (Note 2)
(In thousands)
Reclassifications
For comparative purposes, certain accounts in the consolidated subsidiaries’ financial statements were reclassified to conform
to the Company’s financial statement presentation. Such reclassifications had no effect on the net income or the net equity
reported in the consolidated subsidiaries’ financial statements. Assets and liabilities in the financial industry are classified
based on current arrangement or as other financial assets or liabilities if current arrangement is impossible. In addition, certain
accounts in the consolidated financial statements of the prior period were reclassified for comparative purposes. Such
reclassifications had no effect on the consolidated net income or net equity in the accompanying financial statements of the
prior period.
3. INVENTORIES:
Inventories as of December 31, 2005 and 2004 consist of the following:
79
HYUNDAI MOTOR COMPANY AND SUBSIDIARIES
NOTES TO CONSOLIDATED FINANCIAL STATEMENTS FOR THE YEARS ENDED DECEMBER 31, 2005 AND 2004
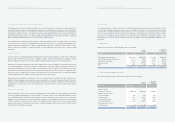
Accounting for Foreign Currency Transaction and Translation
The Company and its domestic subsidiaries maintain their accounts in Korean won. Transactions in foreign currencies are
recorded in Korean won based on the prevailing rates of exchange on the transaction dates. Monetary accounts with balances
denominated in foreign currencies are recorded and reported in the accompanying financial statements at the exchange rates
prevailing at the balance sheet dates. The balances have been translated using the market average exchange rate announced
by Seoul Money Brokerage Services, Ltd., which was ₩1,013.00 and ₩1,043.80 to US$1.00 at December 31, 2005 and
2004, respectively, and translation gains or losses are reflected in current operations.
Assets and liabilities of subsidiaries outside the Republic of Korea are translated at the rate of exchange in effect at the balance
sheet dates; income and expenses of subsidiaries are translated at the average rates of exchange prevailing during the year,
which was ₩1,024.20 and ₩1,146.14 to US$1.00 in 2005 and 2004, respectively. Cumulative translation debits or credits,
which occurred in the translations of financial statements of foreign subsidiaries and branches, are recorded as capital
adjustments.
Income Tax Expense
Income tax expense is determined by adding or deducting the total income tax and surtaxes to be paid for the current period
and the changes in deferred income tax assets or liabilities. In addition, current tax and deferred tax is charged or credited
directly to equity if the tax relates to items that are credited or charged directly to equity in the same or different period.
Deferred tax is recognized on differences between the carrying amounts of assets and liabilities in the financial statements and
the corresponding tax bases used in the computation of taxable profits. Deferred tax liabilities are generally recognized for all
taxable temporary differences with some exceptions and deferred tax assets are recognized to the extent that it is probable
that taxable profit will be available against which the deductible temporary difference can be utilized. The carrying amount of
deferred tax assets is reviewed at each balance sheet date and reduced to the extent that it is no longer probable that
sufficient taxable profits will be available to allow all or part of the assets to be recovered.
Deferred tax assets and liabilities are classified as current or non-current based on the classification of the related assets or
liabilities for financial reporting and according to the expected reversal date of the specific temporary difference if they are not
related to an asset or liability for financial reporting, including deferred tax assets related to carryforwards. Deferred tax assets
and liabilities in the same current or non-current classification are offset if these relate to income tax levied by the same tax
jurisdictions.
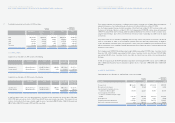
Earnings per Common Share
Primary earnings per common share is computed by dividing net income, after deduction for expected dividends on preferred
stock, by the weighted average number of common shares. The number of shares used in computing earnings per common
share is 209,529,206 and 217,655,607 in 2005 and 2004, respectively. Earnings per diluted common share is computed by
dividing net income, after deduction for expected dividends on preferred stock and addition for the effect of expenses related
to dilutive securities on net income, by the number of the weighted average number of common shares plus the dilutive
potential common shares. The number of shares used in computing earnings per diluted common share is 210,582,591 and
218,223,739 in 2005 and 2004, respectively.