Hyundai 2005 Annual Report Download - page 32
Download and view the complete annual report
Please find page 32 of the 2005 Hyundai annual report below. You can navigate through the pages in the report by either clicking on the pages listed below, or by using the keyword search tool below to find specific information within the annual report.-
 1
1 -
2
-
3
-
4
-
5
-
6
-
7
-
8
-
9
-
10
-
11
-
12
-
13
-
14
-
15
-
16
-
17
-
18
-
19
-
20
-
21
-
 22
22 -
 23
23 -
 24
24 -
 25
25 -
 26
26 -
 27
27 -
 28
28 -
 29
29 -
 30
30 -
 31
31 -
 32
32 -
 33
33 -
 34
34 -
 35
35 -
 36
36 -
 37
37 -
 38
38 -
 39
39 -
 40
40 -
 41
41 -
 42
42 -
43
-
44
-
45
-
46
-
47
-
48
-
49
-
50
-
51
-
52
-
53
-
54
-
55
-
56
-
57
-
58
-
59
-
60
-
61
-
62
-
63
 |
 |

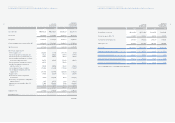
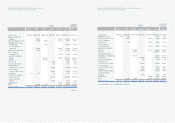
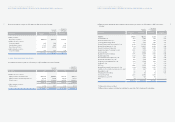
62
HYUNDAI MOTOR COMPANY AND SUBSIDIARIES
CONSOLIDATED STATEMENTS OF INCOME (CONTINUED) FOR THE YEARS ENDED DECEMBER 31, 2005 AND 2004
2005 2004 2005 2004
Income before income tax ₩3,390,058 ₩2,719,948 $3,346,553 $2,685,043
Income tax expense (Note 19) 570,457 921,324 563,136 909,500
Income before minority interests 2,819,601 1,798,624 2,783,417 1,775,543
Minority interests (495,785) (156,683) (489,423) (154,672)
Net income
₩
2,323,816
₩
1,641,941 $2,293,994 $1,620,871
Ordinary income per common share
₩
10,696
₩
7,193 $10.56 $7.10
Earnings per common share
₩
10,696
₩
7,193 $10.56 $7.10
Ordinary income per fully diluted common share
₩
10,642
₩
7,174 $10.51 $7.08
Earnings per fully diluted common share
₩
10,642
₩
7,174 $10.51 $7.08
See accompanying notes to consolidated financial statements.
Korean Won
(In millions, except
per share amounts)
Translation into
U.S. Dollars (Note 2)
(In thousands, except
per share amounts)
61
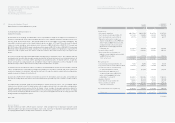
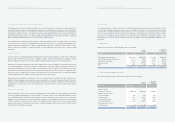
HYUNDAI MOTOR COMPANY AND SUBSIDIARIES
CONSOLIDATED STATEMENTS OF INCOME FOR THE YEARS ENDED DECEMBER 31, 2005 AND 2004
Korean Won
(In millions, except
per share amounts)
Translation into
U.S. Dollars (Note 2)
(In thousands, except
per share amounts)
2005 2004 2005 2004
Sales (Note 25) ₩58,830,632 ₩53,100,621 $58,075,649 $52,419,172
Cost of sales 45,952,958 39,419,561 45,363,236 38,913,683
Gross profit 12,877,674 13,681,060 12,712,413 13,505,489
Selling and administrative expenses (Note 18) 10,586,234 11,299,042 10,450,379 11,154,039
Operating income 2,291,440 2,382,018 2,262,034 2,351,450
Other income (expenses), net:
Interest expense, net (104,457) (1,178) (103,116) (1,163)
Gain on foreign currency translation, net 122,422 200,547 120,851 197,973
Gain on foreign currency transactions, net 170,461 184,966 168,273 182,592
Gain on valuation of investments accounted
for using the equity method, net 538,773 284,264 531,859 280,616
Gain on valuation of investment securities 180,737 - 178,418 -
Gain (loss) on disposal of investments
and other assets, net 158,298 (15,884) 156,267 (15,680)
Loss on disposal of trade receivables (173,744) (114,365) (171,514) (112,897)
Loss on disposal of property, plant and
equipment, net (261,612) (137,193) (258,255) (135,432)
Royalty income 316,685 202,630 312,621 200,030
Reversal of loss (Loss) on impairment
of investments 57,835 (232,476) 57,093 (229,493)
Reversal of accrued warranties and product
liabilities (Note 2) 2,866 305,765 2,829 301,841
Impairment loss on intangibles (Note 10) (7,859) (472,906) (7,758) (466,837)
Other, net 98,213 133,760 96,951 132,043
1,098,618 337,930 1,084,519 333,593
Ordinary income 3,390,058 2,719,948 3,346,553 2,685,043
Extraordinary item - - - -
(continued)