Hyundai 2005 Annual Report Download - page 49
Download and view the complete annual report
Please find page 49 of the 2005 Hyundai annual report below. You can navigate through the pages in the report by either clicking on the pages listed below, or by using the keyword search tool below to find specific information within the annual report.-
 1
1 -
2
-
3
-
4
-
5
-
6
-
7
-
8
-
9
-
10
-
11
-
12
-
13
-
14
-
15
-
16
-
17
-
18
-
19
-
20
-
21
-
22
-
23
-
24
-
25
-
26
-
27
-
28
-
29
-
30
-
31
-
32
-
33
-
34
-
35
-
36
-
37
-
38
-
 39
39 -
 40
40 -
 41
41 -
 42
42 -
 43
43 -
 44
44 -
 45
45 -
 46
46 -
 47
47 -
 48
48 -
 49
49 -
 50
50 -
 51
51 -
 52
52 -
 53
53 -
 54
54 -
 55
55 -
 56
56 -
 57
57 -
 58
58 -
 59
59 -
60
-
61
-
62
-
63
 |
 |
96
HYUNDAI MOTOR COMPANY AND SUBSIDIARIES
NOTES TO CONSOLIDATED FINANCIAL STATEMENTS FOR THE YEARS ENDED DECEMBER 31, 2005 AND 2004
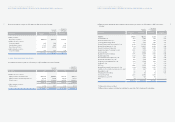
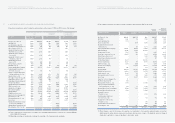
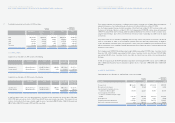
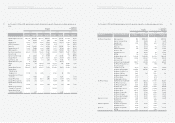
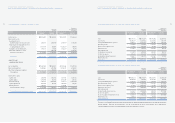
14. LONG-TERM DEBT:
Long-term debt as of December 31, 2005 and 2004 consists of the following:
Description 2005 2005 2004 2005 2004
Debentures 1.19 ~ 9.48 ₩11,950,259 ₩10,028,072 $11,796,899 $9,899,380
Won currency loans:
Capital lease 6.30 ~ 7.77 55,214 14,772 54,505 14,582
Reorganization claims (*) 136,721 328,136 134,966 323,925
General loans 1.00 ~ 8.90 358,431 74,630 353,831 73,672
Other 1.00 ~ 6.47 309,508 376,392 305,537 371,562
859,874 793,930 848,839 783,741
Foreign currency loans:
Capital lease L+0.98 ~ 4.18 33,713 1,643 33,182 1,622
Reorganization claims (*) 55,292 84,994 54,582 83,903
Other 3.25 ~ 5.27 1,147,753 773,870 1,133,122 763,939
1,236,758 860,507 1,220,886 849,464
14,046,891 11,682,509 13,866,624 11,532,585
Less: Current maturities
(3,470,787) (3,998,768) (3,426,246) (3,947,451)
₩10,576,104 ₩7,683,741 $10,440,378 $7,585,134
(*) 3 year non-guaranteed bond circulating earning rate at the end of every quarter
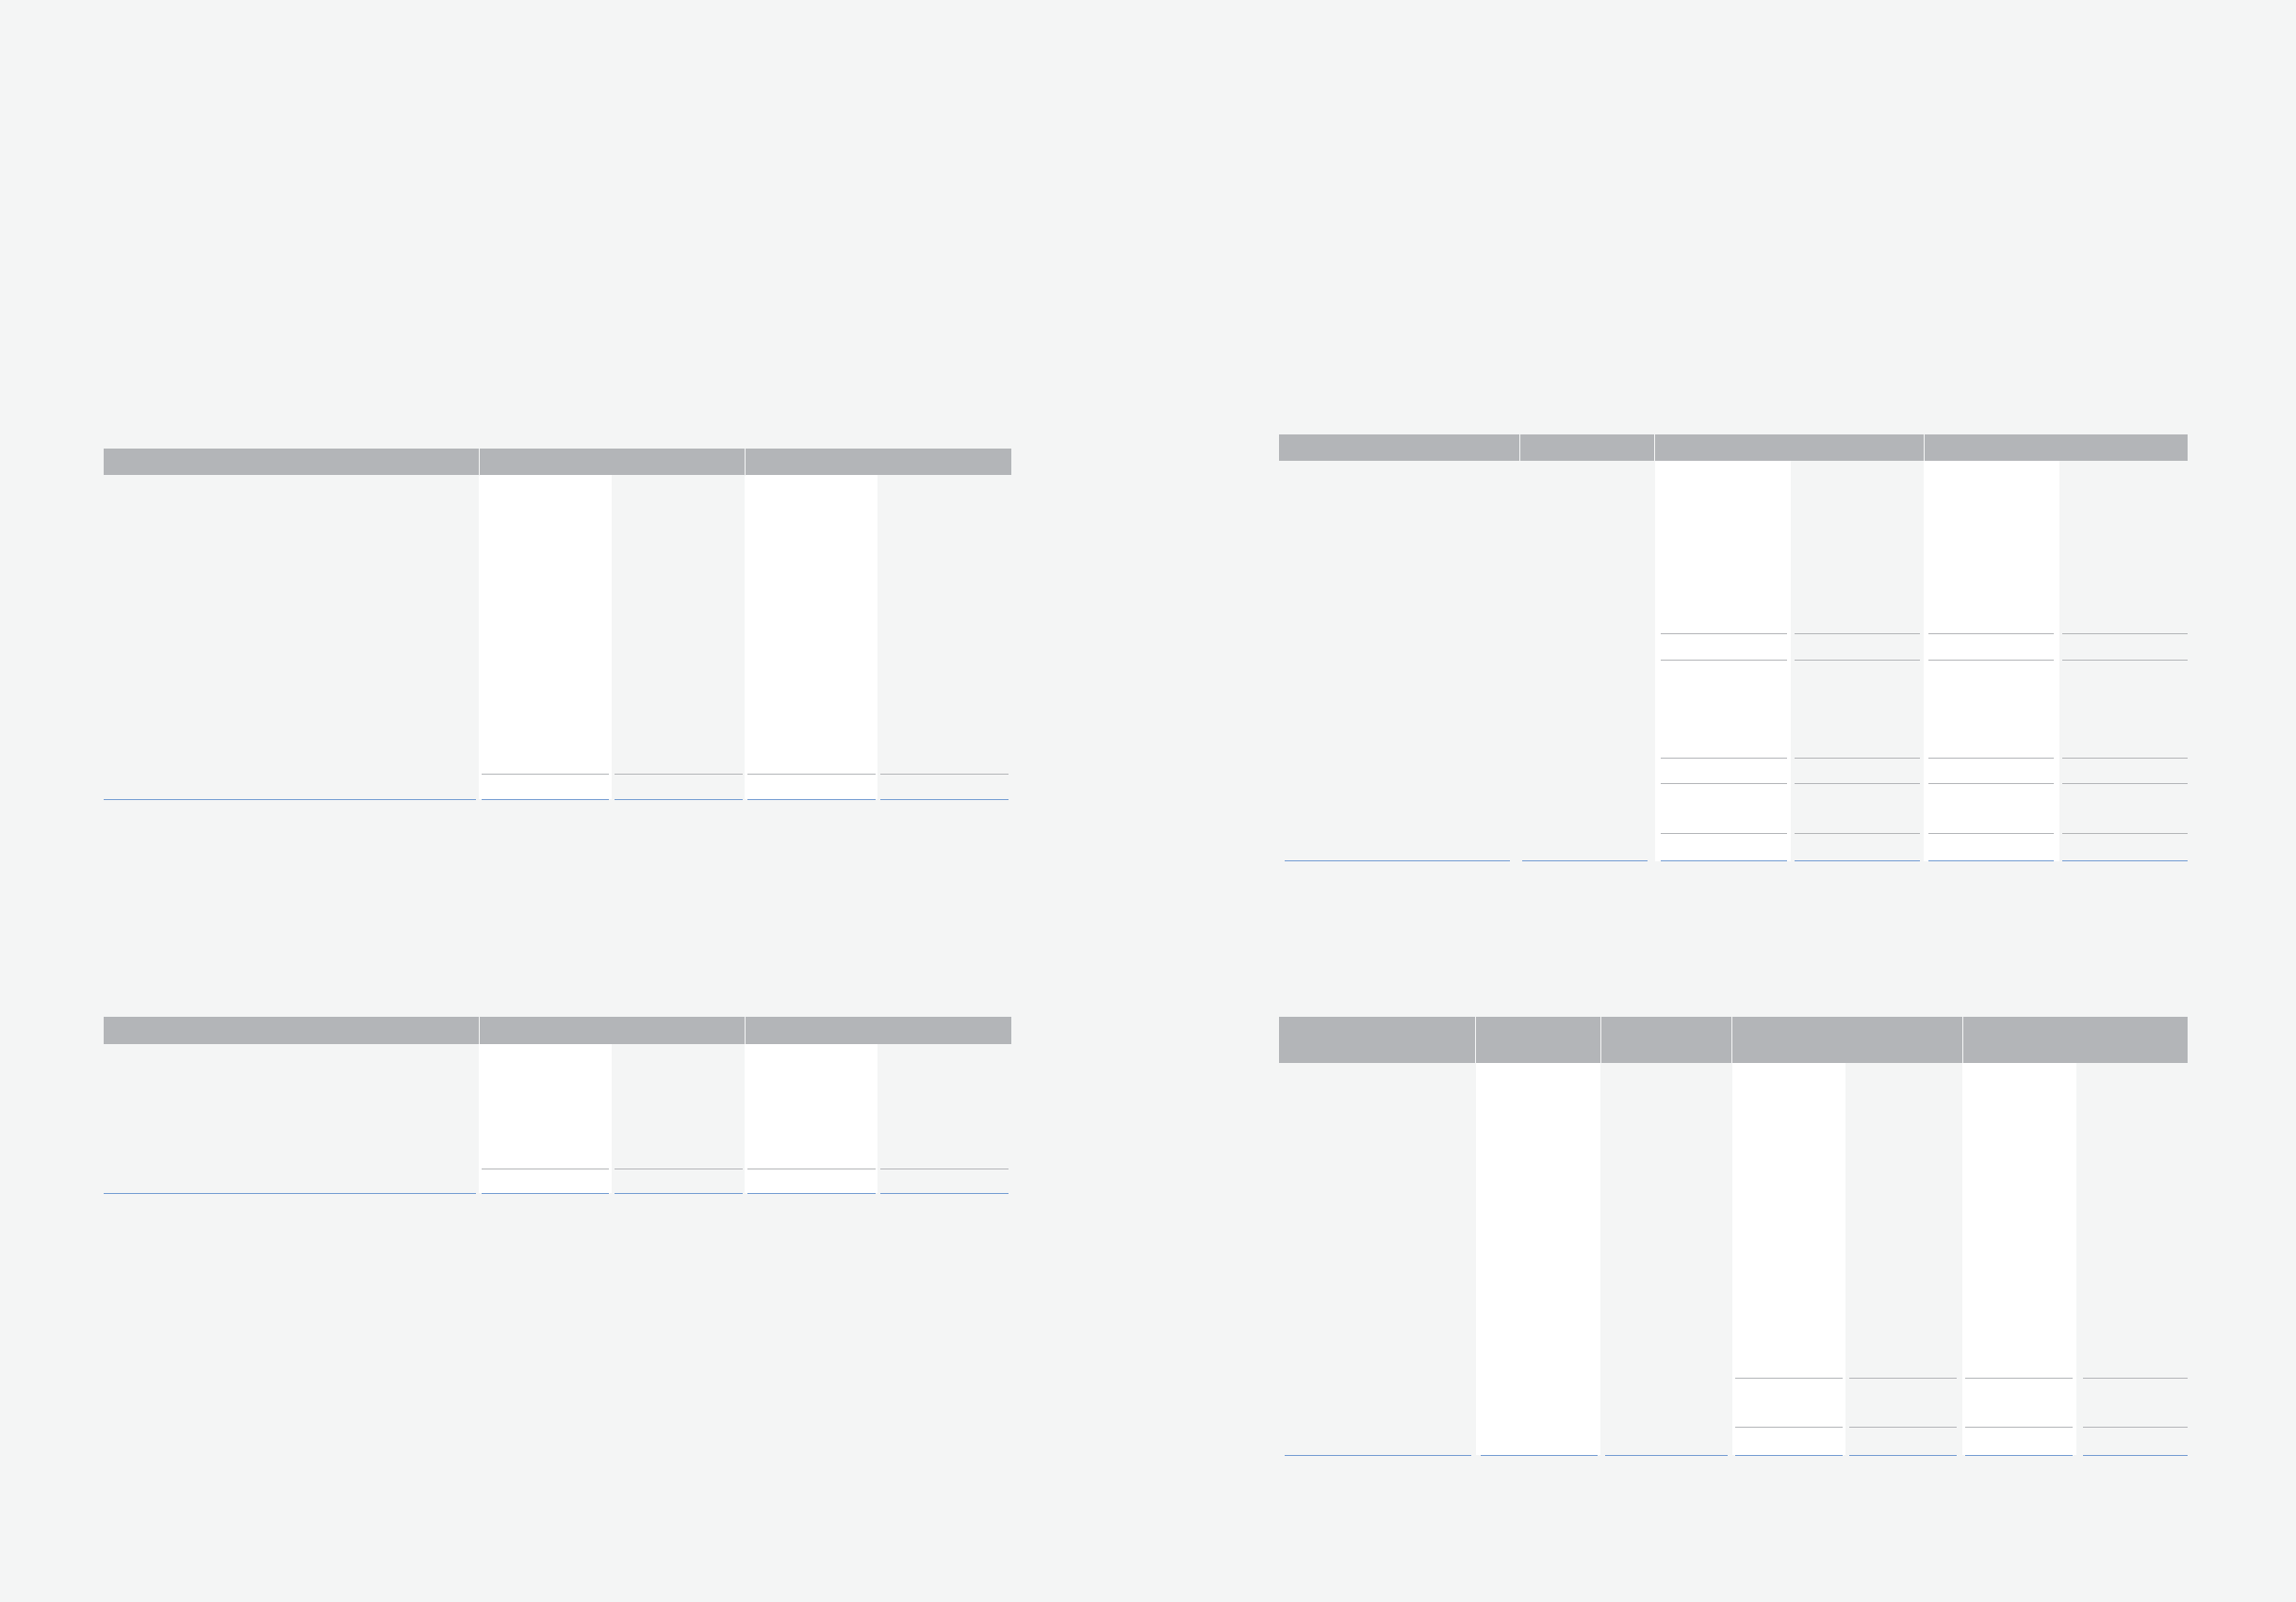
Debentures as of December 31, 2005 and 2004 consist of the following:
Korean Won
(In millions)Interest rate (%)
Translation into
U.S. Dollars (Note 2)
(In thousands)
Description Maturity Annual 2005 2004 2005 2004
interest rate (%)
Domestic debentures:
Guaranteed debentures 6 Jan, 2006 ~
16 Dec, 2008 3.95 ~ 5.67 ₩315,000 ₩220,000 $310,958 $217,177
Non-guaranteed 14 Apr, 2006 ~
Debentures 24 Oct, 2011 1.19 ~ 9.20 10,377,934 8,608,332 10,244,752 8,497,860
Convertible bonds and 31 Jan, 2009 ~
bonds with warranty 31 Oct, 2010 4.0 333,072 135,120 328,798 133,386
Overseas debentures 12 Jun, 2006 ~
25 Apr, 2015 6.68 ~ 9.38 949,915 1,098,887 937,725 1,084,785
11,975,921 10,062,339 11,822,233 9,933,207
Discount on debentures
(25,662) (34,267) (25,334) (33,827)
₩11,950,259 ₩10,028,072 $11,796,899 $9,899,380
Convertible bonds as of December 31, 2005 and 2004 are all issued by Hyundai Card Co., Ltd., a subsidiary.
Korean Won
(In millions)
Translation into
U.S. Dollars (Note 2)
(In thousands)
95
HYUNDAI MOTOR COMPANY AND SUBSIDIARIES
NOTES TO CONSOLIDATED FINANCIAL STATEMENTS FOR THE YEARS ENDED DECEMBER 31, 2005 AND 2004
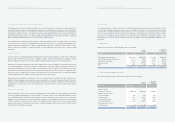
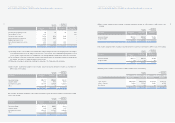
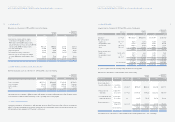
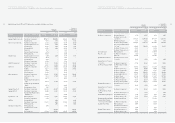
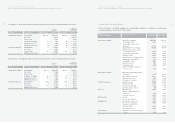
11. OTHER ASSETS:
Other assets as of December 31, 2005 and 2004 consist of the following:
Korean Won
(In millions)
Translation into
U.S. Dollars (Note 2)
(In thousands)
Description 2005 2004 2005 2004
Long-term notes and accounts receivable,
net of allowance for doubtful accounts of
₩90 million in 2005 and ₩61 million in 2004,
and unamortized present value discount of ₩3,095
million in 2005 and ₩3,110 million in 2004 ₩21,239 ₩25,154 $20,966 $24,831
Lease and rental deposits 377,588 378,137 372,742 373,284
Long-term deposits 53,250 49,055 52,567 48,425
Deferred gain on valuation of derivatives 754,224 200,830 744,545 198,253
Long-term loans, net of allowance for doubtful
accounts of ₩5 million in 2005 and nil in 2004 56,023 77,994 55,304 76,993
Other 375,974 348,802 371,150 344,325
₩1,638,298 ₩1,079,972 $1,617,274 $1,066,111
12. OTHER FINANCIAL BUSINESS ASSETS AND LIABILITIES:
Other financial business assets as of December 31, 2005 and 2004 consist of the following:
Korean Won
(In millions)
Translation into
U.S. Dollars (Note 2)
(In thousands)
2005 2004 2005 2004
Finance receivables ₩7,277,317 ₩4,836,945 $7,183,926 $4,774,872
Lease receivables 1,601,497 1,078,509 1,580,945 1,064,668
Card receivables 2,173,722 1,700,092 2,145,826 1,678,275
Other 3,895 8,390 3,845 8,282
₩11,056,431 ₩7,623,936 10,914,542 $7,526,097
Other financial business liabilities of ₩286,329 million (US$ 282,654 thousand) an ₩108,843 million (US$ 107,446 thousand)
as of December 31, 2005 and 2004, respectively, consist of operating other accounts payable.
13. SHORT-TERM BORROWINGS:
Short-term borrowings as of December 31, 2005 and 2004 amount to ₩11,855,332 million (US$11,703,191 thousand) and
₩10,571,772 million (US$10,436,103 thousand), respectively, and consist primarily of bank loans and export financing loans
with annual interest rates ranging from 0.25 percent to 8.83 percent.