Hyundai 2005 Annual Report Download - page 5
Download and view the complete annual report
Please find page 5 of the 2005 Hyundai annual report below. You can navigate through the pages in the report by either clicking on the pages listed below, or by using the keyword search tool below to find specific information within the annual report.-
 1
1 -
 2
2 -
 3
3 -
 4
4 -
 5
5 -
 6
6 -
 7
7 -
 8
8 -
 9
9 -
 10
10 -
 11
11 -
 12
12 -
 13
13 -
 14
14 -
 15
15 -
 16
16 -
17
-
18
-
19
-
20
-
21
-
22
-
23
-
24
-
25
-
26
-
27
-
28
-
29
-
30
-
31
-
32
-
33
-
34
-
35
-
36
-
37
-
38
-
39
-
40
-
41
-
42
-
43
-
44
-
45
-
46
-
47
-
48
-
49
-
50
-
51
-
52
-
53
-
54
-
55
-
56
-
57
-
58
-
59
-
60
-
61
-
62
-
63
 |
 |
0807
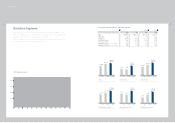
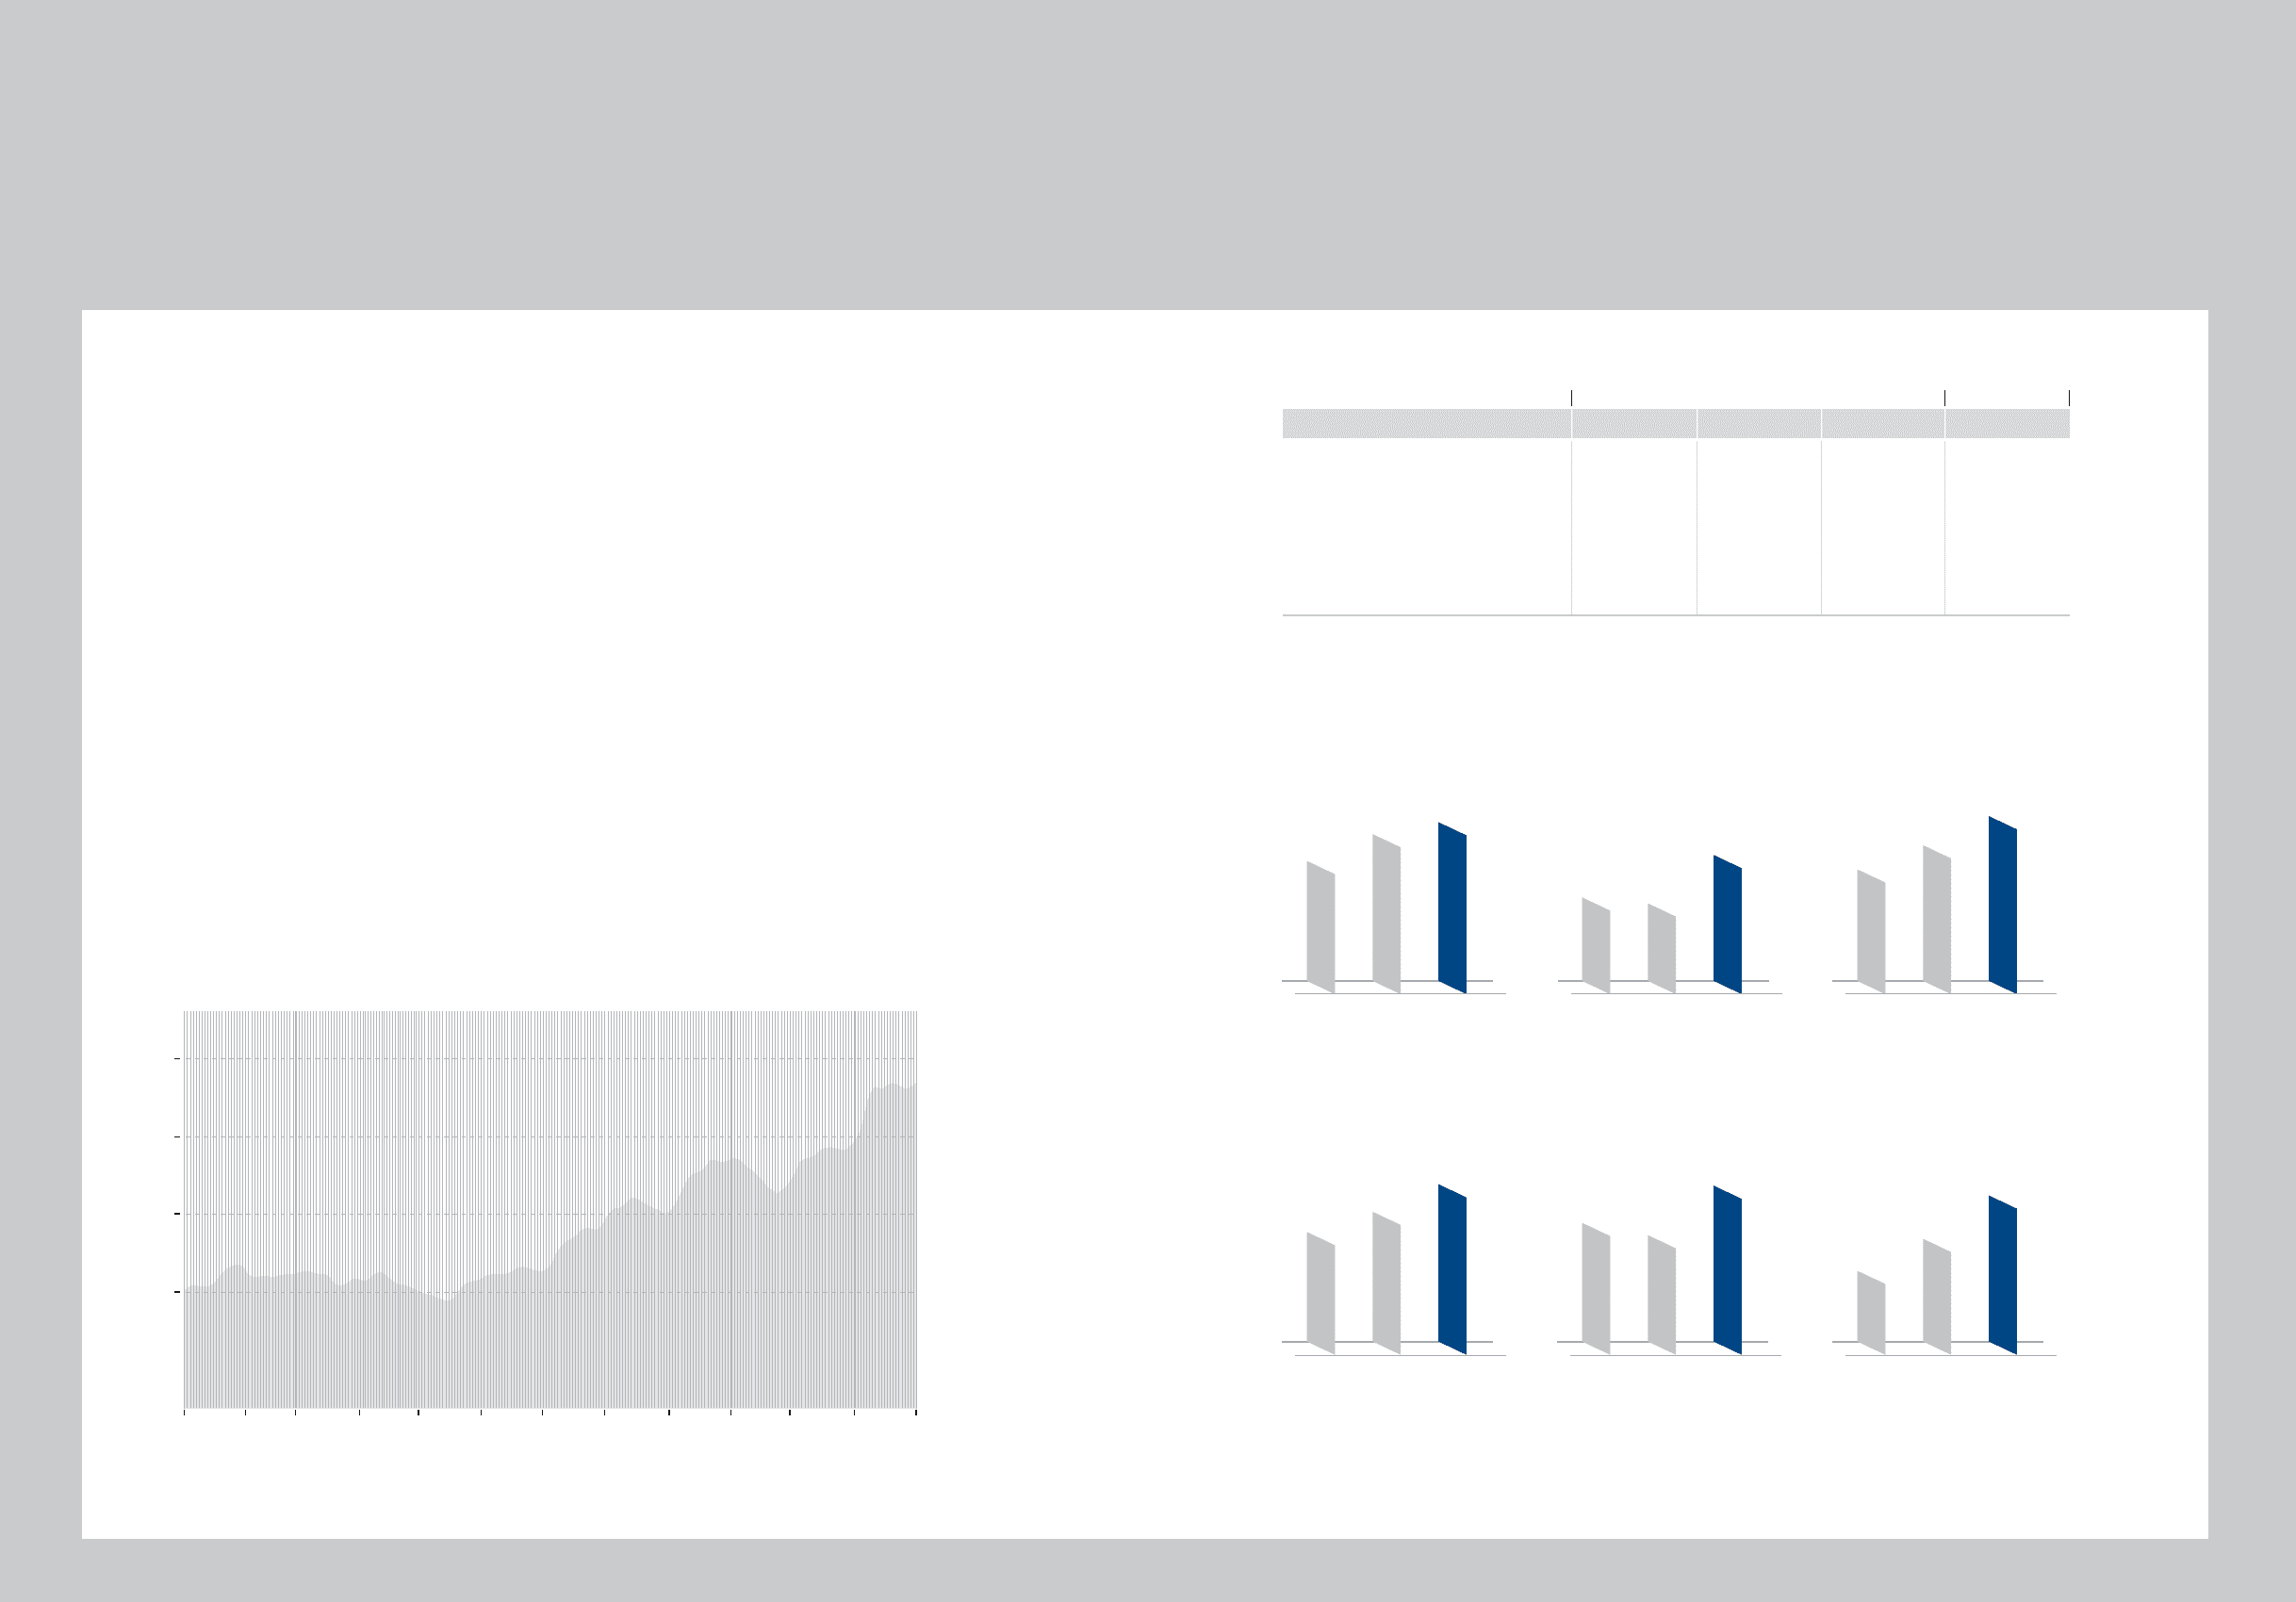
Financial Highlights
Evolution Supreme
With the passage of time we arrive at our moment of greatest distinction.
The current renaissance of Hyundai Motor Company has come from daring
dreams and the will to see those dreams realized.
We now stand at the pinnacle of our achievements and continue to innovate
with progressive style and stunning ingenuity.
'05/01 02 03 04 05 06 07 08 09 10 11 12 '06/01
101,000
85,000
69,000
53,000
2005 2004 2003 2005
Sales
₩58,831 ₩53,101 ₩46,588 $58,076
Net Income
2,324 1,642 1,793 2,294
Total Assets
65,891 58,023 53,427 65,046
Shareholder's Equity
19,640 16,756 15,429 19,388
Earnings Per Share (Korean won, US dollars)
10,696 7,193 7,909 10.56
Dividends Per Share (Korean won, US dollars)
1,250 1,150 1,000 1.234
For the years ended December 31, 2005, 2004, and 2003
Korean won
in billions US dollars
in millions
2003 2004 2005
Sales
Korean won in billions, US dollars in millions
Sales
Korean won in billions, US dollars in millions
2003 2004 2005
Total Assets
Korean won in billions, US dollars in millions
Total Assets
Korean won in billions, US dollars in millions
53,427
58,023
₩65,891
$65,046
Shareholder's Equity
Korean won in billions, US dollars in millions
Shareholder's Equity
Korean won in billions, US dollars in millions
2003 2004 2005
15,429
16,756
₩19,640
$19,388
Earnings Per Share
Korean won, US dollars
Earnings Per Share
Korean won, US dollars
2003 2004 2005
7,909 7,193
₩10,696
$10.56
Dividends Per Share
Korean won, US dollars
Dividends Per Share
Korean won, US dollars
2003 2004 2005
1,000
1,150
₩1,250
$1.234
46,588
53,101 ₩58,831
$58,076
₩2,324
$2,294
2003 2004 2005
Net Income
Korean won in billions, US dollars in millions
Net Income
Korean won in billions, US dollars in millions
1,793 1,642
2005 Share Performance