Hasbro 2007 Annual Report Download - page 79
Download and view the complete annual report
Please find page 79 of the 2007 Hasbro annual report below. You can navigate through the pages in the report by either clicking on the pages listed below, or by using the keyword search tool below to find specific information within the annual report.-
 1
1 -
2
-
3
-
4
-
5
-
6
-
7
-
8
-
9
-
10
-
11
-
12
-
13
-
14
-
15
-
16
-
17
-
18
-
19
-
20
-
21
-
22
-
23
-
24
-
25
-
26
-
27
-
28
-
29
-
30
-
31
-
32
-
33
-
34
-
35
-
36
-
37
-
38
-
39
-
40
-
41
-
42
-
43
-
44
-
45
-
46
-
47
-
48
-
49
-
50
-
51
-
52
-
53
-
54
-
55
-
56
-
57
-
58
-
59
-
60
-
61
-
62
-
63
-
64
-
65
-
66
-
67
-
68
-
 69
69 -
 70
70 -
 71
71 -
 72
72 -
 73
73 -
 74
74 -
 75
75 -
 76
76 -
 77
77 -
 78
78 -
 79
79 -
 80
80 -
 81
81 -
 82
82 -
 83
83 -
 84
84 -
 85
85 -
 86
86 -
 87
87 -
 88
88 -
 89
89 -
90
-
91
-
92
-
93
-
94
-
95
-
96
-
97
-
98
-
99
-
100
 |
 |

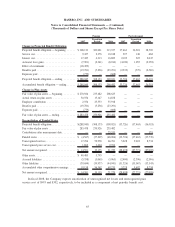
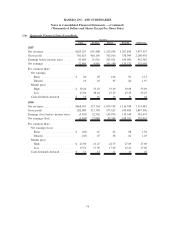
Information by segment and a reconciliation to reported amounts are as follows:
Revenues
from
External
Customers
Affiliate
Revenue
Operating
Profit
(Loss)
Depreciation
and
Amortization
Capital
Additions
Total
Assets
2007
North America .......... $2,460,016 8,094 318,737 50,237 8,917 3,770,504
International............ 1,278,589 — 158,846 21,639 3,326 1,159,173
Global Operations(a) ..... 11,707 1,493,750 19,483 67,519 61,678 1,337,321
Other Segment .......... 87,245 — 38,881 3,515 371 179,095
Corporate and
eliminations(b) ........ — (1,501,844) (16,597) 13,610 17,240 (3,209,030)
Consolidated Total ..... $3,837,557 — 519,350 156,520 91,532 3,237,063
2006
North America .......... $2,130,290 8,266 275,959 51,926 4,278 3,193,870
International............ 959,319 23 90,893 24,681 3,004 859,690
Global Operations(a) ..... 13,185 1,242,354 27,158 46,584 57,487 1,073,871
Other Segment .......... 48,687 — 15,729 2,002 105 134,970
Corporate and
eliminations(b) ........ — (1,250,643) (33,376) 21,514 17,229 (2,165,496)
Consolidated Total ..... $3,151,481 — 376,363 146,707 82,103 3,096,905
2005
North America .......... $2,038,556 11,042 165,676 78,562 7,394 2,658,821
International............ 988,591 124 106,435 33,048 3,866 811,577
Global Operations(a) ..... 10,612 1,171,150 22,712 53,919 49,701 866,125
Other Segment .......... 49,868 — 19,153 997 108 115,864
Corporate and
eliminations(b) ........ — (1,182,316) (26,499) 13,606 9,515 (1,151,244)
Subtotal ............. 3,087,627 — 287,477 180,132 70,584 3,301,143
Stock Compensation(c) . . — — 23,044 — — —
Consolidated Total ..... $3,087,627 — 310,521 180,132 70,584 3,301,143
(a) The Global Operations segment derives substantially all of its revenues, and thus its operating results,
from intersegment activities. Operating profit of the Global Operations segment for the fiscal year 2006
includes a charge of approximately $11,200, primarily related to severance costs, in connection with the
reduction of manufacturing activity at the Company facility in Ireland.
(b) Certain intangible assets, primarily goodwill, which benefit operating segments are reflected as Corporate
assets for segment reporting purposes. For application of SFAS 142, these amounts have been allocated to
the reporting unit which benefits from their use. In addition, allocations of certain expenses related to
these assets to the individual operating segments are done at the beginning of the year based on budgeted
amounts. Any difference between actual and budgeted amounts are reflected in the Corporate segment.
(c) As noted in footnote 10, on December 26, 2005, the first day of fiscal 2006, the Company adopted
SFAS 123R using the modified prospective method. Under this method, the Company recorded stock
71
HASBRO, INC. AND SUBSIDIARIES
Notes to Consolidated Financial Statements — (Continued)
(Thousands of Dollars and Shares Except Per Share Data)