Hasbro 2007 Annual Report Download - page 31
Download and view the complete annual report
Please find page 31 of the 2007 Hasbro annual report below. You can navigate through the pages in the report by either clicking on the pages listed below, or by using the keyword search tool below to find specific information within the annual report.-
 1
1 -
2
-
3
-
4
-
5
-
6
-
7
-
8
-
9
-
10
-
11
-
12
-
13
-
14
-
15
-
16
-
17
-
18
-
19
-
20
-
 21
21 -
 22
22 -
 23
23 -
 24
24 -
 25
25 -
 26
26 -
 27
27 -
 28
28 -
 29
29 -
 30
30 -
 31
31 -
 32
32 -
 33
33 -
 34
34 -
 35
35 -
 36
36 -
 37
37 -
 38
38 -
 39
39 -
 40
40 -
 41
41 -
42
-
43
-
44
-
45
-
46
-
47
-
48
-
49
-
50
-
51
-
52
-
53
-
54
-
55
-
56
-
57
-
58
-
59
-
60
-
61
-
62
-
63
-
64
-
65
-
66
-
67
-
68
-
69
-
70
-
71
-
72
-
73
-
74
-
75
-
76
-
77
-
78
-
79
-
80
-
81
-
82
-
83
-
84
-
85
-
86
-
87
-
88
-
89
-
90
-
91
-
92
-
93
-
94
-
95
-
96
-
97
-
98
-
99
-
100
 |
 |

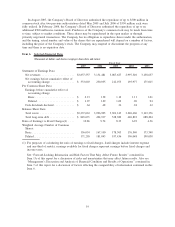
in 2007 and $27,800 in 2006 as the result of the overall weaker U.S. dollar in each of those years. The
following table presents net revenues and operating profit data for the Company’s two principal segments for
2007, 2006 and 2005. The operating profit for 2005 for each of these segments has been adjusted to include
the impact of expense related to stock options as disclosed under SFAS 123, consistent with the Company’s
management reporting. See notes 1 and 15 to the consolidated financial statements for further details.
2007
%
Change 2006
%
Change 2005
Net Revenues
North America ................ $2,460,016 15% $2,130,290 4% $2,038,556
International .................. $1,278,589 33% $ 959,319 (3)% $ 988,591
Operating Profit
North America ................ $ 318,737 16% $ 275,959 67% $ 165,676
International .................. $ 158,846 75% $ 90,893 (15)% $ 106,435
North America
North American segment net revenues for the year ended December 30, 2007 increased 15% to
$2,460,016 from $2,130,290 in 2006. The impact of foreign currency translation on North American segment
net revenues in 2007 was favorable, primarily due to the strength of the Mexican peso and Canadian dollar,
and increased net revenues by approximately $4,800. The increase was due primarily to increased revenues in
the boys’ toys category driven by sales of MARVEL and TRANSFORMERS products due to the theatrical
releases of SPIDER-MAN 3 in May 2007 and TRANSFORMERS in July 2007. Although STAR WARS
product sales declined in 2007 from 2006, sales of these products have continued to be a significant
contributor to boys’ toys revenues in 2007. Revenues in the girls’ toys category increased as a result of higher
sales of LITTLEST PET SHOP and FURREAL FRIENDS products as well as higher revenues from the
BABY ALIVE line which was reintroduced in the second quarter of 2006. To a lesser extent, revenues in the
girls’ toys category were positively impacted by increased shipments of MY LITTLE PONY products. Girls’
toys revenues were negatively impacted by decreased sales of EASY-BAKE oven products due to the recall of
the product in July of 2007. Revenues from the preschool category were flat for 2007. Revenue from games
and puzzles decreased slightly due to lower revenues from trading card and plug and play games partially
offset by increased sales of traditional board games. Revenues from the tweens category decreased as a result
of lower sales of electronic products such as VIDEONOW, ZOOMBOX and I-DOG partially offset by
increased sales of NERF products. Revenues in 2007 were also positively impacted by increased sales of
TOOTH TUNES.
North American operating profit increased to $318,737 in 2007 from $275,959 in 2006. Operating profit
in 2007 was positively impacted by approximately $1,500 due to the translation of foreign currencies to the
U.S. dollar. The increase in operating profit is primarily the result of higher gross profits resulting from the
higher revenues discussed above. Although North American gross profit increased as a result of higher
revenues, this increase in gross profit was negatively impacted by approximately $10,400 of charges recorded
in the second quarter of 2007 related to the July 2007 EASY-BAKE oven recall. The increase in gross profit
was also partially offset by higher royalty expense as the result of the increased sales of MARVEL and
TRANSFORMERS movie-related products. Operating profit was also impacted by higher advertising expense
as well as higher selling and distribution costs related to the increased sales volume. In addition, North
American operating profit included increased investment spending in an online initiative of the Company’s
Wizards of the Coast operation.
North American segment net revenues for the year ended December 31, 2006 increased 4% to $2,130,290
from $2,038,556 in 2005. The impact of foreign currency translation on North American segment net revenues
in 2006 was favorable and increased net revenues by approximately $3,200. Anticipated decreased revenues of
STAR WARS products were more than offset primarily by increased sales of LITTLEST PET SHOP,
PLAYSKOOL, NERF, I-DOG and MONOPOLY products, as well as revenues from the successful reintroduc-
tion of BABY ALIVE. Revenues in 2006 were also positively impacted, to a lesser extent, by increased sales
of PLAY-DOH and TRANSFORMERS products. STAR WARS revenues were significant in 2005 due to the
23