Hasbro 2007 Annual Report Download - page 27
Download and view the complete annual report
Please find page 27 of the 2007 Hasbro annual report below. You can navigate through the pages in the report by either clicking on the pages listed below, or by using the keyword search tool below to find specific information within the annual report.-
 1
1 -
2
-
3
-
4
-
5
-
6
-
7
-
8
-
9
-
10
-
11
-
12
-
13
-
14
-
15
-
16
-
 17
17 -
 18
18 -
 19
19 -
 20
20 -
 21
21 -
 22
22 -
 23
23 -
 24
24 -
 25
25 -
 26
26 -
 27
27 -
 28
28 -
 29
29 -
 30
30 -
 31
31 -
 32
32 -
 33
33 -
 34
34 -
 35
35 -
 36
36 -
 37
37 -
38
-
39
-
40
-
41
-
42
-
43
-
44
-
45
-
46
-
47
-
48
-
49
-
50
-
51
-
52
-
53
-
54
-
55
-
56
-
57
-
58
-
59
-
60
-
61
-
62
-
63
-
64
-
65
-
66
-
67
-
68
-
69
-
70
-
71
-
72
-
73
-
74
-
75
-
76
-
77
-
78
-
79
-
80
-
81
-
82
-
83
-
84
-
85
-
86
-
87
-
88
-
89
-
90
-
91
-
92
-
93
-
94
-
95
-
96
-
97
-
98
-
99
-
100
 |
 |

In August 2007, the Company’s Board of Directors authorized the repurchase of up to $500 million in
common stock after two previous authorizations dated May 2005 and July 2006 of $350 million each were
fully utilized. In February 2008, the Company’s Board of Directors authorized the repurchase of up to an
additional $500 million in common stock. Purchases of the Company’s common stock may be made from time
to time, subject to market conditions. These shares may be repurchased in the open market or through
privately negotiated transactions. The Company has no obligation to repurchase shares under the authorization,
and the timing, actual number and value of the shares that are repurchased will depend on a number of factors,
including the price of the Company’s stock. The Company may suspend or discontinue the program at any
time and there is no expiration date.
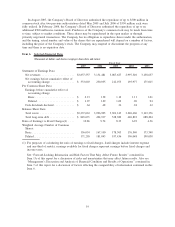
Item 6. Selected Financial Data
(Thousands of dollars and shares except per share data and ratios)
2007 2006 2005 2004 2003
Fiscal Year
Statement of Earnings Data:
Net revenues ..................... $3,837,557 3,151,481 3,087,627 2,997,510 3,138,657
Net earnings before cumulative effect of
accounting change ............... $ 333,003 230,055 212,075 195,977 175,015
Per Common Share Data:
Earnings before cumulative effect of
accounting change
Basic ......................... $ 2.13 1.38 1.19 1.11 1.01
Diluted ........................ $ 1.97 1.29 1.09 .96 .94
Cash dividends declared ............. $ .64 .48 .36 .24 .12
Balance Sheet Data:
Total assets ...................... $3,237,063 3,096,905 3,301,143 3,240,660 3,163,376
Total long-term debt ................ $ 845,071 494,917 528,389 626,822 688,204
Ratio of Earnings to Fixed Charges(1) .... 10.86 9.74 8.33 6.93 4.56
Weighted Average Number of Common
Shares:
Basic ........................... 156,054 167,100 178,303 176,540 173,748
Diluted.......................... 171,205 181,043 197,436 196,048 190,058
(1) For purposes of calculating the ratio of earnings to fixed charges, fixed charges include interest expense
and one-third of rentals; earnings available for fixed charges represent earnings before fixed charges and
income taxes.
See “Forward-Looking Information and Risk Factors That May Affect Future Results” contained in
Item 1A of this report for a discussion of risks and uncertainties that may affect future results. Also see
“Management’s Discussion and Analysis of Financial Condition and Results of Operations” contained in
Item 7 of this report for a discussion of factors affecting the comparability of information contained in this
Item 6.
19