Hasbro 2007 Annual Report Download - page 50
Download and view the complete annual report
Please find page 50 of the 2007 Hasbro annual report below. You can navigate through the pages in the report by either clicking on the pages listed below, or by using the keyword search tool below to find specific information within the annual report.-
 1
1 -
2
-
3
-
4
-
5
-
6
-
7
-
8
-
9
-
10
-
11
-
12
-
13
-
14
-
15
-
16
-
17
-
18
-
19
-
20
-
21
-
22
-
23
-
24
-
25
-
26
-
27
-
28
-
29
-
30
-
31
-
32
-
33
-
34
-
35
-
36
-
37
-
38
-
39
-
 40
40 -
 41
41 -
 42
42 -
 43
43 -
 44
44 -
 45
45 -
 46
46 -
 47
47 -
 48
48 -
 49
49 -
 50
50 -
 51
51 -
 52
52 -
 53
53 -
 54
54 -
 55
55 -
 56
56 -
 57
57 -
 58
58 -
 59
59 -
 60
60 -
61
-
62
-
63
-
64
-
65
-
66
-
67
-
68
-
69
-
70
-
71
-
72
-
73
-
74
-
75
-
76
-
77
-
78
-
79
-
80
-
81
-
82
-
83
-
84
-
85
-
86
-
87
-
88
-
89
-
90
-
91
-
92
-
93
-
94
-
95
-
96
-
97
-
98
-
99
-
100
 |
 |

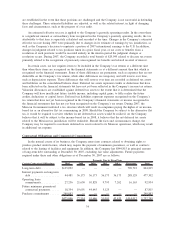
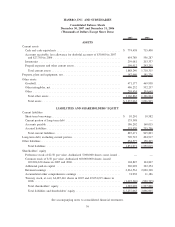
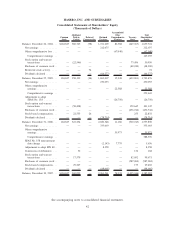
HASBRO, INC. AND SUBSIDIARIES
Consolidated Statements of Shareholders’ Equity
(Thousands of Dollars)
Common
Stock
Additional
Paid-in
Capital
Deferred
Compensation
Retained
Earnings
Accumulated
Other
Comprehensive
Earnings
Treasury
Stock
Total
Shareholders’
Equity
Balance, December 26, 2004 . . . $104,847 380,745 (98) 1,721,209 82,388 (649,367) 1,639,724
Net earnings . . . . . . . . . . . . — — — 212,075 — — 212,075
Other comprehensive loss . . . — — — — (67,040) — (67,040)
Comprehensive earnings . . 145,035
Stock option and warrant
transactions . . . . . . . . . . . — (22,546) — — — 73,496 50,950
Purchases of common stock . . — — — — — (48,030) (48,030)
Restricted stock activity. . . . . — — 74 — — — 74
Dividends declared . . . . . . . . — — — (64,277) — — (64,277)
Balance, December 25, 2005 . . . 104,847 358,199 (24) 1,869,007 15,348 (623,901) 1,723,476
Net earnings . . . . . . . . . . . . — — — 230,055 — — 230,055
Other comprehensive
earnings . . . . . . . . . . . . . . — — — — 22,588 — 22,588
Comprehensive earnings . . 252,643
Adjustment to adopt
SFAS No. 158 . . . . . . . . . — — — — (26,750) — (26,750)
Stock option and warrant
transactions . . . . . . . . . . . — (58,498) — — — 159,645 101,147
Purchases of common stock . . — — — — — (456,744) (456,744)
Stock-based compensation . . . — 22,553 24 — — 255 22,832
Dividends declared . . . . . . . . — — — (78,714) — — (78,714)
Balance, December 31, 2006 . . . 104,847 322,254 — 2,020,348 11,186 (920,745) 1,537,890
Net earnings . . . . . . . . . . . . — — — 333,003 — — 333,003
Other comprehensive
earnings . . . . . . . . . . . . . . — — — — 55,973 — 55,973
Comprehensive earnings . . 388,976
SFAS No. 158 measurement
date change . . . . . . . . . . . — — — (2,143) 7,779 — 5,636
Adjustment to adopt FIN 48. . — — — 8,358 — — 8,358
Conversion of debentures . . . — 32 — — — 136 168
Stock option and warrant
transactions . . . . . . . . . . . — 17,579 — — — 82,092 99,671
Purchases of common stock . . — — — — — (587,004) (587,004)
Stock-based compensation . . . — 29,227 — — — 175 29,402
Dividends declared . . . . . . . . — — — (98,005) — — (98,005)
Balance, December 30, 2007 . . . $104,847 369,092 — 2,261,561 74,938 (1,425,346) 1,385,092
See accompanying notes to consolidated financial statements.
42