Hasbro 2007 Annual Report Download - page 6
Download and view the complete annual report
Please find page 6 of the 2007 Hasbro annual report below. You can navigate through the pages in the report by either clicking on the pages listed below, or by using the keyword search tool below to find specific information within the annual report.-
 1
1 -
 2
2 -
 3
3 -
 4
4 -
 5
5 -
 6
6 -
 7
7 -
 8
8 -
 9
9 -
 10
10 -
 11
11 -
 12
12 -
 13
13 -
 14
14 -
 15
15 -
 16
16 -
 17
17 -
18
-
19
-
20
-
21
-
22
-
23
-
24
-
25
-
26
-
27
-
28
-
29
-
30
-
31
-
32
-
33
-
34
-
35
-
36
-
37
-
38
-
39
-
40
-
41
-
42
-
43
-
44
-
45
-
46
-
47
-
48
-
49
-
50
-
51
-
52
-
53
-
54
-
55
-
56
-
57
-
58
-
59
-
60
-
61
-
62
-
63
-
64
-
65
-
66
-
67
-
68
-
69
-
70
-
71
-
72
-
73
-
74
-
75
-
76
-
77
-
78
-
79
-
80
-
81
-
82
-
83
-
84
-
85
-
86
-
87
-
88
-
89
-
90
-
91
-
92
-
93
-
94
-
95
-
96
-
97
-
98
-
99
-
100
 |
 |

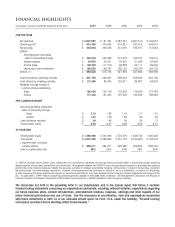
(1) EBITDA (earnings before interest, taxes, depreciation and amortization) represents net earnings before cumulative effect of accounting change, excluding
interest expense, income taxes, depreciation and amortization. Management believes that EBITDA is one of the appropriate measures for evaluating the operating
performance of the Company because it refl ects the resources available for strategic opportunities including, among others, to invest in the business, strengthen
the balance sheet, and make strategic acquisitions. However, this measure should be considered in addition to, not as a substitute for, or superior to net earnings
or other measures of fi nancial performance prepared in accordance with GAAP as more fully discussed in the Company’s fi nancial statements and fi lings with the
SEC. As used herein, “GAAP” refers to accounting principles generally accepted in the United States of America. See Management’s Discussion and Analysis of
Financial Condition and Results of Operations in the enclosed annual report for a detailed discussion of the Company’s business.
The discussion set forth in the preceding letter to our shareholders and in the annual report that follow it contains
forward-looking statements concerning our expectations and beliefs, including, without limitation, expectations regarding
our future business plans, product introductions, entertainment releases, revenues, earnings and other aspects of our
future fi nancial performance and use of funds. See the discussion of uncertainties, risks and assumptions associated
with these statements in Item 1A of our enclosed annual report on Form 10-K, under the heading, “Forward-Looking
Information and Risk Factors that May Affect Future Results.”
FOR THE YEAR
Net revenues $ 3,837,557 3,151,481 3,087,627 2,997,510 3,138,657
Operating profi t $ 519,350 376,363 310,521 293,012 344,616
Net earnings $ 333,003 230,055 212,075 195,977 157,664
EBITDA
Earnings before cumulative
effect of accounting change $ 333,003 230,055 212,075 195,977 175,015
Interest expense $ 34,618 27,521 30,537 31,698 52,462
Income taxes $ 129,379 111,419 98,838 64,111 69,049
Depreciation and amortization $ 156,520 146,707 180,132 146,180 164,123
EBITDA (1) $ 653,520 515,702 521,582 437,966 460,649
Cash provided by operating activities $ 601,794 320,647 496,624 358,506 454,155
Cash utilized by investing activities $ 112,465 83,604 120,671 84,967 64,879
Weighted average number of
common shares outstanding
Basic 156,054 167,100 178,303 176,540 173,748
Diluted 171,205 181,043 197,436 196,048 190,058
PER COMMON SHARE
Net earnings before cumulative
effect of accounting change
Basic $ 2.13 1.38 1.19 1.11 1.01
Diluted $ 1.97 1.29 1.09 .96 .94
Cash dividends declared $ .64 .48 .36 .24 .12
Shareholders’ equity $ 9.54 9.57 9.69 9.25 8.01
AT YEAR END
Shareholders’ equity $ 1,385,092 1,537,890 1,723,476 1,639,724 1,405,240
Total assets $ 3,237,063 3,096,905 3,301,143 3,240,660 3,163,376
Long-term debt, including
current portions $ 845,071 494,917 528,389 626,822 688,204
Debt to capitalization ratio 38% 25% 24% 28% 34%
FINANCIAL HIGHLIGHTS
(Thousands of Dollars and Shares Except Per Share Data) 2007 2006 2005 2004 2003