Hasbro 2007 Annual Report Download - page 30
Download and view the complete annual report
Please find page 30 of the 2007 Hasbro annual report below. You can navigate through the pages in the report by either clicking on the pages listed below, or by using the keyword search tool below to find specific information within the annual report.-
 1
1 -
2
-
3
-
4
-
5
-
6
-
7
-
8
-
9
-
10
-
11
-
12
-
13
-
14
-
15
-
16
-
17
-
18
-
19
-
 20
20 -
 21
21 -
 22
22 -
 23
23 -
 24
24 -
 25
25 -
 26
26 -
 27
27 -
 28
28 -
 29
29 -
 30
30 -
 31
31 -
 32
32 -
 33
33 -
 34
34 -
 35
35 -
 36
36 -
 37
37 -
 38
38 -
 39
39 -
 40
40 -
41
-
42
-
43
-
44
-
45
-
46
-
47
-
48
-
49
-
50
-
51
-
52
-
53
-
54
-
55
-
56
-
57
-
58
-
59
-
60
-
61
-
62
-
63
-
64
-
65
-
66
-
67
-
68
-
69
-
70
-
71
-
72
-
73
-
74
-
75
-
76
-
77
-
78
-
79
-
80
-
81
-
82
-
83
-
84
-
85
-
86
-
87
-
88
-
89
-
90
-
91
-
92
-
93
-
94
-
95
-
96
-
97
-
98
-
99
-
100
 |
 |

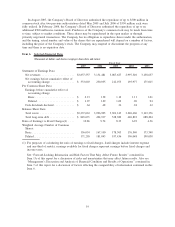
Summary
The components of the results of operations, stated as a percent of net revenues, are illustrated below for
each of the three fiscal years ended December 30, 2007.
2007 2006 2005
Net revenues .............................................. 100.0% 100.0% 100.0%
Cost of sales .............................................. 41.1 41.4 41.7
Gross profit ............................................... 58.9 58.6 58.3
Amortization .............................................. 1.8 2.5 3.3
Royalties ................................................. 8.2 5.4 8.0
Research and product development .............................. 4.4 5.4 4.9
Advertising ............................................... 11.3 11.7 11.8
Selling, distribution and administration ........................... 19.7 21.7 20.2
Operating profit ............................................ 13.5 11.9 10.1
Interest expense ............................................ 0.9 0.9 1.0
Interest income............................................. (0.8) (0.9) (0.8)
Other (income) expense, net ................................... 1.4 1.1 (0.2)
Earnings before income taxes .................................. 12.0 10.8 10.1
Income taxes .............................................. 3.3 3.5 3.2
Net earnings ............................................... 8.7% 7.3% 6.9%
Results of Operations
The fiscal years ended December 30, 2007 and December 25, 2005 were fifty-two week periods while the
fiscal year ended December 31, 2006 was a fifty-three week period.
Net earnings for the fiscal year ended December 30, 2007 were $333,003, or $1.97 per diluted share. This
compares to net earnings for fiscal 2006 and 2005 of $230,055 and $212,075, or $1.29 and $1.09 per diluted
share, respectively.
Net earnings includes non-operating (income) expense related to the change in fair value of certain
warrants required to be classified as a liability of $44,370 in 2007, $31,770 in 2006, and $(2,080) in 2005.
These warrants were repurchased during May 2007. Net earnings for 2007 also includes a favorable tax
adjustment of $29,619, or $0.17 per diluted share, related to the recognition of certain previously unrecognized
tax benefits.
Net earnings for 2005 include income tax expense of approximately $25,800 related to the Company’s
repatriation of approximately $547,000 of foreign earnings in the fourth quarter of 2005 pursuant to the special
incentive provided by the American Jobs Creation Act of 2004.
On December 26, 2005, the first day of fiscal 2006, the Company adopted Statement of Financial
Accounting Standards No. 123 (revised 2004), “Share-Based Payment” (“SFAS 123R”), which required that
the Company measure all stock-based compensation awards using a fair value method and record such expense
in its financial statements. The Company adopted this statement using the modified prospective method. Under
this adoption method, the Company is recording expense related to stock option awards that were unvested as
of the date of adoption as well as all awards made after the date of adoption. Accordingly, 2005 net earnings
do not include expense related to stock options.
Consolidated net revenues for the year ended December 30, 2007 were $3,837,557 compared to
$3,151,481 in 2006 and $3,087,627 in 2005. Most of the Company’s net revenues and operating profits were
derived from its two principal segments: North America and International, which are discussed in detail below.
Consolidated net revenues were positively impacted by foreign currency translation in the amount of $94,500
22