Hasbro 2007 Annual Report Download - page 33
Download and view the complete annual report
Please find page 33 of the 2007 Hasbro annual report below. You can navigate through the pages in the report by either clicking on the pages listed below, or by using the keyword search tool below to find specific information within the annual report.-
 1
1 -
2
-
3
-
4
-
5
-
6
-
7
-
8
-
9
-
10
-
11
-
12
-
13
-
14
-
15
-
16
-
17
-
18
-
19
-
20
-
21
-
22
-
 23
23 -
 24
24 -
 25
25 -
 26
26 -
 27
27 -
 28
28 -
 29
29 -
 30
30 -
 31
31 -
 32
32 -
 33
33 -
 34
34 -
 35
35 -
 36
36 -
 37
37 -
 38
38 -
 39
39 -
 40
40 -
 41
41 -
 42
42 -
 43
43 -
44
-
45
-
46
-
47
-
48
-
49
-
50
-
51
-
52
-
53
-
54
-
55
-
56
-
57
-
58
-
59
-
60
-
61
-
62
-
63
-
64
-
65
-
66
-
67
-
68
-
69
-
70
-
71
-
72
-
73
-
74
-
75
-
76
-
77
-
78
-
79
-
80
-
81
-
82
-
83
-
84
-
85
-
86
-
87
-
88
-
89
-
90
-
91
-
92
-
93
-
94
-
95
-
96
-
97
-
98
-
99
-
100
 |
 |

also negatively impacted by approximately $10,400 in charges related to the recall of the Company’s EASY-
BAKE oven product and by a charge of approximately $10,000 related to a restructuring and related reduction
in work force at the Company’s manufacturing facility in East Longmeadow, Massachusetts. This charge
consisted primarily of severance costs.
The Company’s gross profit margin was 58.6% for the year ended December 31, 2006 compared to
58.3% in 2005. The increase was due to increased revenues from certain core brand products that have higher
gross margins, such as LITTLEST PET SHOP products and traditional board games, such as MONOPOLY.
Gross profit in 2006 was negatively impacted by a charge of approximately $10,300 related to the Company’s
decision to transfer certain manufacturing activities from its Ireland manufacturing facility to its suppliers in
China. Gross margin in 2005 was also negatively impacted by inventory obsolescence and customer allowances
on plug and play games.
Expenses
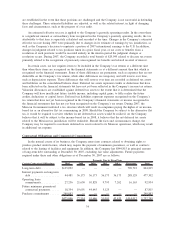
The Company’s operating expenses, stated as percentages of net revenues, are illustrated below for the
three fiscal years ended December 30, 2007:
2007 2006 2005
Amortization ................................................. 1.8% 2.5% 3.3%
Royalties .................................................... 8.2 5.4 8.0
Research and product development ................................. 4.4 5.4 4.9
Advertising .................................................. 11.3 11.7 11.8
Selling, distribution and administration .............................. 19.7 21.7 20.2
Amortization expense continued to decrease in 2007 to $67,716 from $78,934 in 2006 and $102,035 in
2005. A portion of amortization expense relates to licensing rights and is based on expected sales of products
related to those licensing rights. The decrease in amortization expense in 2007 and 2006 primarily relates to
decreased amortization of the product rights related to STAR WARS.
Royalty expense increased to $316,807 or 8.2% of net revenues in 2007 compared to $169,731 or 5.4%
of net revenues in 2006. This increase is primarily due to increased sales of entertainment-based products,
primarily MARVEL and TRANSFORMERS movie-related products due to the theatrical releases of
SPIDER-MAN 3 and TRANSFORMERS in 2007. Royalty expense decreased to $169,731 or 5.4% of net
revenues in 2006 compared to $247,283 or 8.0% of net revenues in 2005. This decrease primarily relates to
the decrease in sales of STAR WARS products in 2006 from 2005.
Research and product development expense decreased in 2007 to $167,194 or 4.4% of net revenues from
$171,358 or 5.4% of net revenues in 2006. This decrease reflects higher investments in the prior year,
primarily related to the MARVEL product lines. Research and product development expense increased in 2006
to $171,358 or 5.4% of net revenues from $150,586 or 4.9% of net revenues in 2005. This increase was the
result of development expenses related to the MARVEL line of products as well as increased investment in the
PLAYSKOOL line.
Advertising expense increased in dollars to $434,742 in 2007 from $368,996 in 2006, but decreased as a
percentage of revenues to 11.3% from 11.7% in 2006. The decrease as a percentage of revenues primarily
relates to the mix of sales in 2007, which included increased sales of entertainment-based products, which
require lower amounts of advertising and promotion. Revenues related to entertainment-based properties have
increased in 2007 with the release of the SPIDER-MAN 3 and TRANSFORMERS movies. The increase in
dollars is primarily due to continued investment in our PLAYSKOOL line as well as other core brands, and to
a lesser extent, the impact of foreign exchange. Advertising expense in 2006 was $368,996 or 11.7% of net
revenues which was consistent with the 2005 expense of $366,371 or 11.8% of net revenues.
Selling, distribution and administration expenses increased in dollars to $755,127 from $682,214 in 2006
but decreased as a percentage of revenues to 19.7% from 21.7% in 2006. The increase in dollars reflects
higher variable selling and distribution costs resulting from higher revenues in 2007, as well as higher
25