Google 2013 Annual Report Download - page 81
Download and view the complete annual report
Please find page 81 of the 2013 Google annual report below. You can navigate through the pages in the report by either clicking on the pages listed below, or by using the keyword search tool below to find specific information within the annual report.-
 1
1 -
2
-
3
-
4
-
5
-
6
-
7
-
8
-
9
-
10
-
11
-
12
-
13
-
14
-
15
-
16
-
17
-
18
-
19
-
20
-
21
-
22
-
23
-
24
-
25
-
26
-
27
-
28
-
29
-
30
-
31
-
32
-
33
-
34
-
35
-
36
-
37
-
38
-
39
-
40
-
41
-
42
-
43
-
44
-
45
-
46
-
47
-
48
-
49
-
50
-
51
-
52
-
53
-
54
-
55
-
56
-
57
-
58
-
59
-
60
-
61
-
62
-
63
-
64
-
65
-
66
-
67
-
68
-
69
-
70
-
 71
71 -
 72
72 -
 73
73 -
 74
74 -
 75
75 -
 76
76 -
 77
77 -
 78
78 -
 79
79 -
 80
80 -
 81
81 -
 82
82 -
 83
83 -
 84
84 -
 85
85 -
 86
86 -
 87
87 -
 88
88 -
 89
89 -
 90
90 -
 91
91 -
92
-
93
-
94
-
95
-
96
 |
 |

PART II
ITEM8.Notes to Consolidated Financial Statements
Information about Segments and Geographic Areas
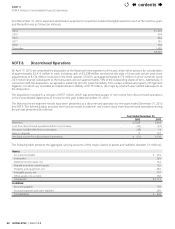
SubsequenttothecompletionofourdispositionoftheMotorolaHomesegmentonApril17,2013,weoperateinthefollowing
twooperatingsegments:
Google—includesouradvertisingandothernon-advertisingbusinesses
MotorolaMobile—includesourmobiledevicesbusinessacquiredfromMotorola
Ourchiefoperatingdecisionmakerdoesnotevaluateoperatingsegmentsusingassetinformation.
Thefollowingtablesetsforthrevenuesandoperatingincome(loss)byoperatingsegment(inmillions):
Google
Motorola
Mobile
Elimination
and unallocated
items(1)(2) Total
Year Ended December 31, 2011
Revenues $ 37,905 0 0 $37,905
Income(loss)fromoperations $ 14,216 0 (2,474) $ 11,742
Year Ended December 31, 2012
Revenues $ 46,039 4,136 0 $ 50,175
Income(loss)fromoperations $16,308 (393) (3,155) $ 12,760
Year Ended December 31, 2013
Revenues $ 55,550 4,443 (168) $ 59,825
Income(loss)fromoperations $ 18,561 (1,029) (3,566) $ 13,966
(1) Beginninginthethirdquarterof2013,GoogleandMotorolaMobilesegmentrevenueshavebeenimpactedbyintersegmenttransactions
thatareeliminatedinconsolidation.Additionally,segmentrevenuesassociatedwithcertainproductsarerecognizedinthesegmentresults,
butdeferredtofutureperiodsinourconsolidatedfinancialstatements.
(2) Unallocated items, including stock-based compensation expense, as well as restructuring and other charges are not allocated to each
segmentbecausewedonotincludethisinformationinourmeasurementoftheperformanceofouroperatingsegments.
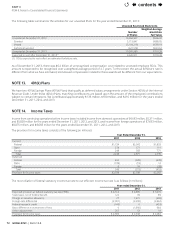
RevenuesbygeographyarebasedonthebillingaddressesofourcustomersfortheGooglesegmentandtheship-to-addresses
ofourcustomersfortheMotorolaMobilesegment.Thefollowingtablessetforthrevenuesandlong-livedassetsbygeographic
area(inmillions):
Year Ended December31,
2011 2012 2013
Revenues:
United States $17,560 $23,502 $26,768
United Kingdom 4,057 4,872 5,638
Restoftheworld 16,288 21,801 27,419
Total revenues $37,905 $50,175 $59,825
As of December 31,
2012 2013
Long-livedassets(1):
United States $ 20,985 $ 24,004
International 12,359 14,030
Totallong-livedassets $ 33,344 $ 38,034
(1) IncludestheMotorolaHomesegmentasofDecember31,2012
contents