Google 2013 Annual Report Download - page 28
Download and view the complete annual report
Please find page 28 of the 2013 Google annual report below. You can navigate through the pages in the report by either clicking on the pages listed below, or by using the keyword search tool below to find specific information within the annual report.-
 1
1 -
2
-
3
-
4
-
5
-
6
-
7
-
8
-
9
-
10
-
11
-
12
-
13
-
14
-
15
-
16
-
17
-
 18
18 -
 19
19 -
 20
20 -
 21
21 -
 22
22 -
 23
23 -
 24
24 -
 25
25 -
 26
26 -
 27
27 -
 28
28 -
 29
29 -
 30
30 -
 31
31 -
 32
32 -
 33
33 -
 34
34 -
 35
35 -
 36
36 -
 37
37 -
 38
38 -
39
-
40
-
41
-
42
-
43
-
44
-
45
-
46
-
47
-
48
-
49
-
50
-
51
-
52
-
53
-
54
-
55
-
56
-
57
-
58
-
59
-
60
-
61
-
62
-
63
-
64
-
65
-
66
-
67
-
68
-
69
-
70
-
71
-
72
-
73
-
74
-
75
-
76
-
77
-
78
-
79
-
80
-
81
-
82
-
83
-
84
-
85
-
86
-
87
-
88
-
89
-
90
-
91
-
92
-
93
-
94
-
95
-
96
 |
 |
22 GOOGLE INC.
PART II
ITEM5.Market for Registrant’s Common Equity, Related Stockholder Matters and Issuer Purchases of Equity Securities
Results of Google’s Transferable Stock Option (TSO) Program
UnderourTSOprogram,eligibleemployeeswereabletosellvestedstockoptionstoparticipatingnancialinstitutionsin
anonlineauctionasanalternativetoexercisingoptionsinthetraditionalmethodandthensellingtheunderlyingshares.
TheTSOprogramwasdiscontinuedasofNovember29,2013.
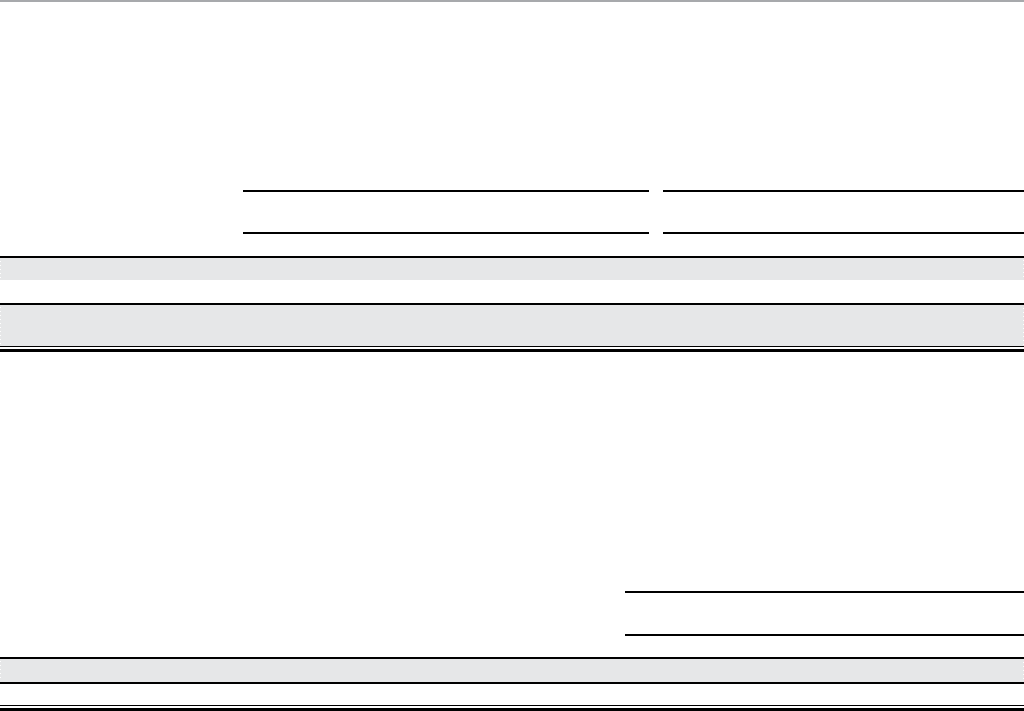
The following table provides information with respect to sales by our employees of TSOs for the period from October 1,
2013toNovember29,2013,whichisthedatetheTSOprogramwasdiscontinued.
Period(1)
Aggregate Amounts Weighted-Average Per Share Amounts
Number of Shares
Underlying TSOs Sold
Sale Price
ofTSOs Sold
TSO
Premium(2)
Exercise Price
of TSOsSold
Sale Price
ofTSOs Sold
TSO
Premium(2)
(in thousands)
October 1 – 31 79,104 $47,600 $36 $415.67 $601.73 $0.46
November 1 – 29 50,621 32,957 22 390.62 651.06 0.44
Total(exceptweighted-average
per share amounts) 129,725 $80,557 $58 $405.90 $620.98 $0.45
(1) The TSO program was generally active during regular trading hours for the Nasdaq Global Select Market when our trading window was
open.However,wehadtherighttosuspendtheTSOprogramatanytimeforanyreason,includingformaintenanceandothertechnical
reasons.
(2) TSO premium was calculated as the difference between (a) the sale price of the TSO and (b) the intrinsic value of the TSO, which we define
astheexcess,ifany,ofthepriceofourClassAcommonstockatthetimeofthesaleovertheexercisepriceoftheTSO.
OurTSOprogramallowedparticipationbyexecutiveocers(otherthanLarryPage,SergeyBrin,andEricE.Schmidt).The
followingtableprovidesinformationwithrespecttosalesbyourexecutiveocersofTSOsfortheperiodfromOctober1,2013
to November 29, 2013, which is the date the TSO program was discontinued:
Executive Ocer
Aggregate Amounts
Number of Shares
Underlying TSOs Sold
Sale Price
ofTSOs Sold
TSO
Premium
(in thousands)
Patrick Pichette 4,330 $1,943 $ 0
Total 4,330 $1,943 $ 0
contents