Google 2013 Annual Report Download - page 61
Download and view the complete annual report
Please find page 61 of the 2013 Google annual report below. You can navigate through the pages in the report by either clicking on the pages listed below, or by using the keyword search tool below to find specific information within the annual report.-
 1
1 -
2
-
3
-
4
-
5
-
6
-
7
-
8
-
9
-
10
-
11
-
12
-
13
-
14
-
15
-
16
-
17
-
18
-
19
-
20
-
21
-
22
-
23
-
24
-
25
-
26
-
27
-
28
-
29
-
30
-
31
-
32
-
33
-
34
-
35
-
36
-
37
-
38
-
39
-
40
-
41
-
42
-
43
-
44
-
45
-
46
-
47
-
48
-
49
-
50
-
 51
51 -
 52
52 -
 53
53 -
 54
54 -
 55
55 -
 56
56 -
 57
57 -
 58
58 -
 59
59 -
 60
60 -
 61
61 -
 62
62 -
 63
63 -
 64
64 -
 65
65 -
 66
66 -
 67
67 -
 68
68 -
 69
69 -
 70
70 -
 71
71 -
72
-
73
-
74
-
75
-
76
-
77
-
78
-
79
-
80
-
81
-
82
-
83
-
84
-
85
-
86
-
87
-
88
-
89
-
90
-
91
-
92
-
93
-
94
-
95
-
96
 |
 |

55
PART II
ITEM8.NotestoConsolidatedFinancialStatements
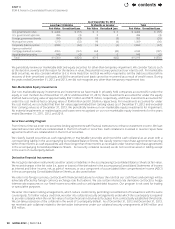
ThefollowingtablesetsforththecomputationofbasicanddilutednetincomepershareofClassAandClassBcommonstock
(inmillions,exceptshareamountswhicharereectedinthousandsandpershareamounts):
Year Ended December31,
2011 2012 2013
Class A Class B Class A Class B Class A Class B
Basicnetincome(loss)pershare:
Numerator
Allocationofundistributed
earnings—continuingoperations $7,658 $2,079 $ 8,641 $2,147 $ 10,037 $ 2,177
Allocationofundistributed
earnings—discontinuedoperations 0 0 (41) (10) 580 126
Total $7,658 $2,079 $ 8,600 $2,137 $ 10,617 $ 2,303
Denominator
Numberofsharesused
inpersharecomputation 253,862 68,916 262,078 65,135 273,518 59,328
Basicnetincome(loss)pershare
Continuingoperations $30.17 $30.17 $ 32.97 $32.97 $ 36.70 $ 36.70
Discontinuedoperations 0 0 (0.16) (0.16) 2.12 2.12
Basicnetincomepershare $30.17 $30.17 $32.81 $32.81 $38.82 $38.82
Dilutednetincomepershare:
Numerator
Allocationofundistributedearningsfor
basiccomputation—continuingoperations $7,658 $2,079 $ 8,641 $2,147 $ 10,037 $ 2,177
Reallocationofundistributedearnings
asaresultofconversionofClassB
toClassAshares 2,079 0 2,147 0 2,177 0
Reallocationofundistributedearnings
toClassBshares 0 (27) 0 (31) 0 (38)
Allocationofundistributed
earnings—continuingoperations $9,737 $2,052 $ 10,788 $2,116 $ 12,214 $ 2,139
Allocationofundistributedearningsforbasic
computation-discontinuedoperations $0$0 $ (41) $ (10) $580 $126
Reallocationofundistributedearnings
asaresultofconversionofClassB
toClassAshares 0 0 (10) 0 126 0
Reallocationofundistributedearnings
toClassBshares 0 0 0 0 0 (2)
Allocationofundistributed
earnings—discontinuedoperations $0$0 $ (51) $ (10) $706 $124
Denominator
Numberofsharesused
inbasiccomputation 253,862 68,916 262,078 65,135 273,518 59,328
Weighted-averageeectofdilutivesecurities
Add:
ConversionofClassBtoClassAcommon
sharesoutstanding 68,916 0 65,135 0 59,328 0
Employeestockoptions,including
warrantsissuedunderTransferableStock
Optionprogram 2,958 46 2,944 34 2,748 4
Restrictedstockunits 1,478 0 2,148 0 3,215 0
Numberofsharesused
inpersharecomputation 327,214 68,962 332,305 65,169 338,809 59,332
Dilutednetincome(loss)pershare:
Continuingoperations $29.76 $29.76 $ 32.46 $32.46 $ 36.05 $ 36.05
Discontinuedoperations 0 0 (0.15) (0.15) 2.08 2.08
Dilutednetincomepershare $29.76 $29.76 $32.31 $32.31 $38.13 $38.13
ThenetincomepershareamountsarethesameforClassAandClassBcommonstockbecausetheholdersofeachclassare
legallyentitledtoequalpersharedistributionswhetherthroughdividendsorinliquidation.
contents