Google 2013 Annual Report Download - page 69
Download and view the complete annual report
Please find page 69 of the 2013 Google annual report below. You can navigate through the pages in the report by either clicking on the pages listed below, or by using the keyword search tool below to find specific information within the annual report.-
 1
1 -
2
-
3
-
4
-
5
-
6
-
7
-
8
-
9
-
10
-
11
-
12
-
13
-
14
-
15
-
16
-
17
-
18
-
19
-
20
-
21
-
22
-
23
-
24
-
25
-
26
-
27
-
28
-
29
-
30
-
31
-
32
-
33
-
34
-
35
-
36
-
37
-
38
-
39
-
40
-
41
-
42
-
43
-
44
-
45
-
46
-
47
-
48
-
49
-
50
-
51
-
52
-
53
-
54
-
55
-
56
-
57
-
58
-
 59
59 -
 60
60 -
 61
61 -
 62
62 -
 63
63 -
 64
64 -
 65
65 -
 66
66 -
 67
67 -
 68
68 -
 69
69 -
 70
70 -
 71
71 -
 72
72 -
 73
73 -
 74
74 -
 75
75 -
 76
76 -
 77
77 -
 78
78 -
 79
79 -
80
-
81
-
82
-
83
-
84
-
85
-
86
-
87
-
88
-
89
-
90
-
91
-
92
-
93
-
94
-
95
-
96
 |
 |
63
PART II
ITEM8.Notes to Consolidated Financial Statements
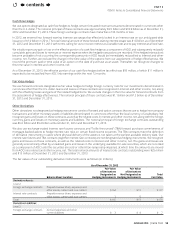
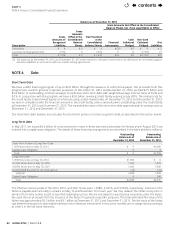
InAugust2013,weenteredintoacapitalleaseobligationoncertainpropertyexpiringin2028withanoptiontopurchasethe
propertyin2016.Theeectiverateofthecapitalleaseobligationapproximatesthemarketrate.Theestimatedfairvalueofthe
capitalleaseobligationapproximateditscarryingvalueatDecember31,2013.
AtDecember31,2013,aggregatefutureprincipalpaymentsforlong-termdebt(includingshort-termportionoflong-termdebt)
andcapitalleaseobligationwereasfollows(inmillions):
Years ending
2014 $ 1,009
2015 10
2016 1,236
2017 0
Thereafter 1,000
Total $3,255
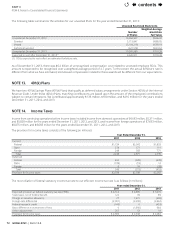
Balance Sheet Components
Inventories
Inventoriesconsistedofthefollowing(inmillions):
As of
December31,
2012
As of
December31,
2013
Rawmaterialsandworkinprocess $ 77 $115
Finished goods 428 311
Inventories $505 $426
Property and Equipment
Propertyandequipmentconsistedofthefollowing(inmillions):
As of
December31,
2012
As of
December31,
2013
Informationtechnologyassets $ 7,717 $ 9,094
Landandbuildings 6,257 7,488
Constructioninprogress 2,240 5,602
Leaseholdimprovements 1,409 1,576
Furnitureandxtures 74 77
Total 17,697 23,837
Less:accumulateddepreciationandamortization 5,843 7,313
Propertyandequipment,net $11,854 $16,524
Propertyundercapitalleasewithacostbasisof$258millionwasincludedinconstructioninprogressasofDecember31,2013.
Accumulated Other Comprehensive Income
ThecomponentsofAOCI,netoftax,wereasfollows(inmillions):
Foreign
Currency
Translation
Adjustments
Unrealized
Gains (Losses)
on Available-
for-Sale
Investments
Unrealized
Gains on Cash
Flow Hedges Total
BalanceasofDecember31,2012 $ (73) $ 604 $ 7 $ 538
Othercomprehensiveincome(loss)
beforereclassications 89 (392) 112 (191)
AmountsreclassiedfromAOCI 0(162)(60) (222)
Othercomprehensiveincome(loss) 89 (554) 52 (413)
BalanceasofDecember31,2013 $16 $ 50 $ 59 $ 125
contents