Google 2013 Annual Report Download - page 29
Download and view the complete annual report
Please find page 29 of the 2013 Google annual report below. You can navigate through the pages in the report by either clicking on the pages listed below, or by using the keyword search tool below to find specific information within the annual report.-
 1
1 -
2
-
3
-
4
-
5
-
6
-
7
-
8
-
9
-
10
-
11
-
12
-
13
-
14
-
15
-
16
-
17
-
18
-
 19
19 -
 20
20 -
 21
21 -
 22
22 -
 23
23 -
 24
24 -
 25
25 -
 26
26 -
 27
27 -
 28
28 -
 29
29 -
 30
30 -
 31
31 -
 32
32 -
 33
33 -
 34
34 -
 35
35 -
 36
36 -
 37
37 -
 38
38 -
 39
39 -
40
-
41
-
42
-
43
-
44
-
45
-
46
-
47
-
48
-
49
-
50
-
51
-
52
-
53
-
54
-
55
-
56
-
57
-
58
-
59
-
60
-
61
-
62
-
63
-
64
-
65
-
66
-
67
-
68
-
69
-
70
-
71
-
72
-
73
-
74
-
75
-
76
-
77
-
78
-
79
-
80
-
81
-
82
-
83
-
84
-
85
-
86
-
87
-
88
-
89
-
90
-
91
-
92
-
93
-
94
-
95
-
96
 |
 |
23
PART II
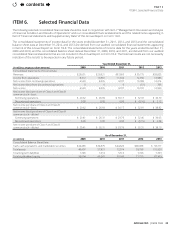
ITEM6.Selected Financial Data
Selected Financial Data
ThefollowingselectedconsolidatednancialdatashouldbereadinconjunctionwithItem7“Management’sDiscussionandAnalysis
ofFinancialConditionandResultsofOperations”andourconsolidatednancialstatementsandtherelatednotesappearingin
Item8“FinancialStatementsandSupplementaryData”ofthisAnnualReportonForm10-K.
The consolidated statements of income data for the years ended December 31, 2011, 2012, and 2013 and the consolidated
balancesheetdataatDecember31,2012,and2013arederivedfromourauditedconsolidatednancialstatementsappearing
inItem8ofthisAnnualReportonForm10-K.TheconsolidatedstatementsofincomedatafortheyearsendedDecember31,
2009 and 2010, and the consolidated balance sheet data at December 31, 2009, 2010, and 2011, are derived from our audited
consolidatednancialstatementsthatarenotincludedinthisAnnualReportonForm10-K.Thehistoricalresultsarenotnecessarily
indicativeoftheresultstobeexpectedinanyfutureperiod.
(in millions, except per share amounts)
Year Ended December31,
2009 2010 2011 2012 2013
Consolidated Statements of Income Data:
Revenues $23,651 $29,321 $37,905 $50,175 $59,825
Income from operations 8,312 10,381 11,742 12,760 13,966
Net income from continuing operations 6,520 8,505 9,737 10,788 12,214
Net income (loss) from discontinued operations 0 0 0 (51) 706
Net income 6,520 8,505 9,737 10,737 12,920
Net income (loss) per share of Class A and Class B
common stock—basic
Continuing operations $ 20.62 $26.69 $30.17 $32.97 $36.70
Discontinued operations 0.00 0.00 0.00 $(0.16) $ 2.12
Net income per share of Class A and Class B
common stock—basic $ 20.62 $26.69 $30.17 $32.81 $38.82
Net income (loss) per share of Class A and Class B
common stock—diluted
Continuing operations $ 20.41 $26.31 $29.76 $32.46 $36.05
Discontinued operations 0.00 0.00 0.00 $(0.15) $ 2.08
Net income per share of Class A and Class B
common stock—diluted $ 20.41 $26.31 $29.76 $32.31 $38.13
(in millions)
As of December31,
2009 2010 2011 2012 2013
Consolidated Balance Sheet Data:
Cash, cash equivalents, and marketable securities $24,485 $34,975 $44,626 $48,088 $ 58,717
Total assets 40,497 57,851 72,574 93,798 110,920
Totallong-termliabilities 1,746 1,614 5,516 7,746 7,703
Total stockholders’ equity 36,004 46,241 58,145 71,715 87,309
contents