Google 2013 Annual Report Download - page 32
Download and view the complete annual report
Please find page 32 of the 2013 Google annual report below. You can navigate through the pages in the report by either clicking on the pages listed below, or by using the keyword search tool below to find specific information within the annual report.-
 1
1 -
2
-
3
-
4
-
5
-
6
-
7
-
8
-
9
-
10
-
11
-
12
-
13
-
14
-
15
-
16
-
17
-
18
-
19
-
20
-
21
-
 22
22 -
 23
23 -
 24
24 -
 25
25 -
 26
26 -
 27
27 -
 28
28 -
 29
29 -
 30
30 -
 31
31 -
 32
32 -
 33
33 -
 34
34 -
 35
35 -
 36
36 -
 37
37 -
 38
38 -
 39
39 -
 40
40 -
 41
41 -
 42
42 -
43
-
44
-
45
-
46
-
47
-
48
-
49
-
50
-
51
-
52
-
53
-
54
-
55
-
56
-
57
-
58
-
59
-
60
-
61
-
62
-
63
-
64
-
65
-
66
-
67
-
68
-
69
-
70
-
71
-
72
-
73
-
74
-
75
-
76
-
77
-
78
-
79
-
80
-
81
-
82
-
83
-
84
-
85
-
86
-
87
-
88
-
89
-
90
-
91
-
92
-
93
-
94
-
95
-
96
 |
 |

GOOGLE INC.
PART II
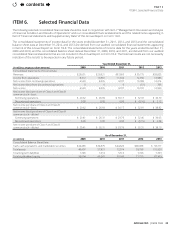
ITEM7.Management’sDiscussionandAnalysisofFinancialConditionandResultsofOperations
The following table presents our historical operating results as a percentage of revenues for the periods indicated:
Year Ended December31,
2011 2012 2013
Consolidated Statements of Income Data:
Revenues:
Google (advertising and other) 100.0%91.8%92.8%
Motorola Mobile (hardware and other) 0.0 8.2 7.2
Total revenues 100.0%100.0%100.0%
Costs and expenses:
Cost of revenues—Google (advertising and other) 34.8 34.2 36.8
Cost of revenues—Motorola Mobile (hardware and other) 0.0 6.9 6.5
Research and development 13.6 13.5 13.3
Sales and marketing 12.1 12.2 12.1
General and administrative 7.2 7.8 8.0
Charge related to the resolution of Department of Justice investigation 1.3 0 0
Total costs and expenses 69.0%74.6%76.7%
Income from operations 31.0 25.4 23.3
Interest and other income, net 1.5 1.3 0.9
Income from continuing operations before income taxes 32.5 26.7 24.2
Provision for income taxes 6.8 5.2 3.8
Net income from continuing operations 25.7 21.5 20.4
Net income (loss) from discontinued operations 0.0 (0.1) 1.2
Net income 25.7%21.4%21.6%
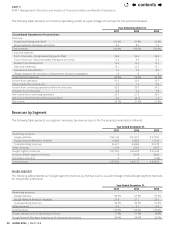
Revenues by Segment
The following table presents our segment revenues, by revenue source, for the periods presented (in millions):
Year Ended December31,
2011 2012 2013
Advertising revenues:
Google websites $26,145 $31,221 $ 37,453
Google Network Members' websites 10,386 12,465 13,125
Total advertising revenues 36,531 43,686 50,578
Other revenues 1,374 2,353 4,972
Google segment revenues $37,905 $46,039 $ 55,550
Motorola Mobile segment revenues 0 4,136 4,443
Elimination and other 0 0 (168)
Total revenues $37,905 $50,175 $59,825
The following table presents our Google segment revenues, by revenue source, as a percentage of total Google segment revenues
for the periods presented:
Year Ended December31,
2011 2012 2013
Advertising revenues:
Google websites 69.0%67.8%67.4%
Google Network Members' websites 27.4 27.1 23.6
Total advertising revenues 96.4%94.9%91.0%
Other revenues 3.6 5.1 9.0
Total revenues 100.0%100.0%100.0%
Google websites as % of advertising revenues 71.6%71.5%74.0%
Google Network Members’ websites as % of advertising revenues 28.4%28.5%26.0%
contents