Google 2013 Annual Report Download - page 34
Download and view the complete annual report
Please find page 34 of the 2013 Google annual report below. You can navigate through the pages in the report by either clicking on the pages listed below, or by using the keyword search tool below to find specific information within the annual report.-
 1
1 -
2
-
3
-
4
-
5
-
6
-
7
-
8
-
9
-
10
-
11
-
12
-
13
-
14
-
15
-
16
-
17
-
18
-
19
-
20
-
21
-
22
-
23
-
 24
24 -
 25
25 -
 26
26 -
 27
27 -
 28
28 -
 29
29 -
 30
30 -
 31
31 -
 32
32 -
 33
33 -
 34
34 -
 35
35 -
 36
36 -
 37
37 -
 38
38 -
 39
39 -
 40
40 -
 41
41 -
 42
42 -
 43
43 -
 44
44 -
45
-
46
-
47
-
48
-
49
-
50
-
51
-
52
-
53
-
54
-
55
-
56
-
57
-
58
-
59
-
60
-
61
-
62
-
63
-
64
-
65
-
66
-
67
-
68
-
69
-
70
-
71
-
72
-
73
-
74
-
75
-
76
-
77
-
78
-
79
-
80
-
81
-
82
-
83
-
84
-
85
-
86
-
87
-
88
-
89
-
90
-
91
-
92
-
93
-
94
-
95
-
96
 |
 |

28 GOOGLE INC.
PART II
ITEM7.Management’sDiscussionandAnalysisofFinancialConditionandResultsofOperations
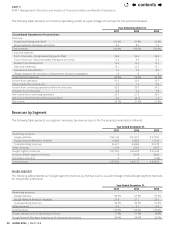
Beginning in the third quarter of 2013, Google and Motorola Mobile segment revenues have been impacted by intersegment
transactionsthatareeliminatedinconsolidation.Additionally,segmentrevenuesassociatedwithcertainproductswererecognized
duringtheyearinoursegmentresults,butdeferredtofutureperiodsinourconsolidatednancialstatements.Thispresentation
is consistent with what is provided to the chief operating decision maker for purposes of making decisions about allocating
resourcestoeachsegmentandassessingtheirperformance.
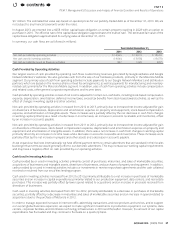
Revenues by Geography
The following table presents our Google segment domestic and international revenues as a percentage of Google segment
revenues, determined based on the billing addresses of our customers for our Google segment:
Year Ended December31,
2011 2012 2013
United States 46% 46% 45%
UnitedKingdom 11% 11% 10%
Rest of the world 43% 43% 45%
The following table presents our consolidated domestic and international revenues as a percentage of consolidated revenues,
determinedbasedonthebillingaddressesofourcustomersforourGooglesegment,andship-toaddressesofourcustomers
for our Motorola Mobile segment:
Year Ended December31,
2011 2012 2013
United States 46% 47% 45%
UnitedKingdom 11% 10% 9%
Rest of the world 43% 43% 46%
The growth in revenues from the rest of the world as a percentage of the Google segment and consolidated revenues from 2012
to 2013 resulted largely from increased acceptance of our advertising programs, and our continued progress in developing
localizedversionsofourproductsfortheinternationalmarketsaswellasincreasedrevenuesfromtherestoftheworldinour
MotorolaMobilesegmentin2013ascomparedto2012.
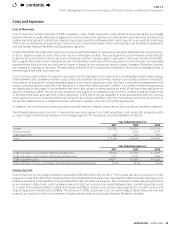
Foreign Exchange Impact on Revenues
ThegeneralstrengtheningoftheU.S.dollarrelativetocertainforeigncurrencies(primarilytheJapaneseyenandBrazilianreal)
from2012to2013hadanunfavorableimpactonourinternationalrevenues,whichwaspartiallyosetbythegeneralweakening
oftheU.S.dollarrelativetootherforeigncurrencies(primarilytheEuro).Hadforeignexchangeratesremainedconstantinthese
periods,ourrevenuesfromtheUnitedKingdomwouldhavebeen$67millionor1.2%higherandourrevenuesfromtherestof
theworldwouldhavebeenapproximately$613millionor2.2%higherin2013.Thisisbeforeconsiderationofhedginggainsof
$63millionand$32millionrecognizedtorevenuesfromtheUnitedKingdomandtherestoftheworldin2013.
ThegeneralstrengtheningoftheU.S.dollarrelativetocertainforeigncurrencies(primarilytheEuro)from2011to2012hadan
unfavorableimpactonourinternationalrevenues.Hadforeignexchangeratesremainedconstantintheseperiods,ourrevenues
fromtheUnitedKingdomwouldhavebeen$68millionor1.4%higherandourrevenuesfromtherestoftheworldwouldhave
beenapproximately$1,211millionor5.6%higherin2012.Thisisbeforeconsiderationofhedginggainsof$18millionand
$199millionrecognizedtorevenuesfromtheUnitedKingdomandtherestoftheworldin2012.
Although we expect to continue to make investments in international markets, these investments may not result in an increase
inourinternationalrevenuesasapercentageoftotalrevenuesin2014orthereafter.SeeNote15ofNotestoConsolidated
FinancialStatementsincludedinItem8ofthisAnnualReportonForm10-Kforadditionalinformationaboutgeographicareas.
contents