Google 2013 Annual Report Download - page 33
Download and view the complete annual report
Please find page 33 of the 2013 Google annual report below. You can navigate through the pages in the report by either clicking on the pages listed below, or by using the keyword search tool below to find specific information within the annual report.-
 1
1 -
2
-
3
-
4
-
5
-
6
-
7
-
8
-
9
-
10
-
11
-
12
-
13
-
14
-
15
-
16
-
17
-
18
-
19
-
20
-
21
-
22
-
 23
23 -
 24
24 -
 25
25 -
 26
26 -
 27
27 -
 28
28 -
 29
29 -
 30
30 -
 31
31 -
 32
32 -
 33
33 -
 34
34 -
 35
35 -
 36
36 -
 37
37 -
 38
38 -
 39
39 -
 40
40 -
 41
41 -
 42
42 -
 43
43 -
44
-
45
-
46
-
47
-
48
-
49
-
50
-
51
-
52
-
53
-
54
-
55
-
56
-
57
-
58
-
59
-
60
-
61
-
62
-
63
-
64
-
65
-
66
-
67
-
68
-
69
-
70
-
71
-
72
-
73
-
74
-
75
-
76
-
77
-
78
-
79
-
80
-
81
-
82
-
83
-
84
-
85
-
86
-
87
-
88
-
89
-
90
-
91
-
92
-
93
-
94
-
95
-
96
 |
 |

PART II
ITEM7.Management’sDiscussionandAnalysisofFinancialConditionandResultsofOperations
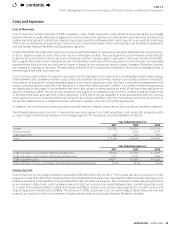
OurGooglesegmentrevenuesincreased$9,511millionfrom2012to2013.Thisincreaseresultedprimarilyfromanincrease
in advertising revenues generated by Google websites and an increase in other revenues, and to a lesser extent, an increase in
advertisingrevenuesgeneratedbyGoogleNetworkMembers’websites.Theincreaseinotherrevenueswasmainlydrivenby
highersalesrelatedtodigitalcontentandhardwareproducts.TheincreaseinadvertisingrevenuesforGooglewebsitesandGoogle
Network Members’ websites resulted primarily from an increase in the number of paid clicks through our advertising programs,
aspaidclicksonGooglewebsitesandGoogleNetworkMembers’websitesincreasedapproximately25%from2012to2013.The
increaseinthenumberofpaidclicksgeneratedthroughouradvertisingprogramswasduetocertainmonetizationimprovements
includingnewandricheradformats,anincreaseinaggregatetracacrossallplatforms,thecontinuedglobalexpansionofour
products,advertisers,anduserbase,aswellasanincreaseinthenumberofGoogleNetworkMembers,partiallyosetbycertain
advertisingpolicychanges.Theimpactfromtheincreaseinpaidclicksonourrevenuegrowthwaspartiallyosetbyadecrease
intheaveragecost-per-clickpaidbyouradvertisers.Averagecost-per-clickonGooglewebsitesandGoogleNetworkMembers’
websitesdecreasedapproximately8%from2012to2013.Thedecreaseintheaveragecost-per-clickpaidbyouradvertisers
was driven by various factors, such as the introduction of new products as well as changes in property mix, platform mix and
geographicalmix,andthegeneralstrengtheningoftheU.S.dollarcomparedtocertainforeigncurrencies.
OurGooglesegmentrevenuesincreased$8,134millionfrom2011to2012.Thisincreaseresultedprimarilyfromanincreasein
advertising revenues generated by Google websites and Google Network Members’ websites and, to a lesser extent, an increase
inotherrevenuesdrivenbyhardwareproductsales.TheincreaseinadvertisingrevenuesforGooglewebsitesandGoogle
Network Members’ websites resulted primarily from an increase in the number of paid clicks through our advertising programs,
as aggregate paid clicks on Google websites and Google Network Members’ websites increased approximately 34% from 2011 to
2012.Theincreaseinthenumberofpaidclicksgeneratedthroughouradvertisingprogramswasduetoanincreaseinaggregate
tracacrossallplatforms,certainmonetizationimprovementsincludingnewadformats,thecontinuedglobalexpansionofour
products,advertisers,anduserbase,aswellasanincreaseinthenumberofGoogleNetworkMembers.Theimpactofthisincrease
waspartiallyosetbyadecreaseintheaveragecost-per-clickpaidbyouradvertisers.Averagecost-per-clickonGooglewebsites
andGoogleNetworkMembers’websitesdecreasedapproximately12%from2011to2012.Thedecreaseintheaveragecost-per-
click paid by our advertisers was driven by various factors, such as introduction of new products as well as changes in property
mix,platformmixandgeographicalmix,andthegeneralstrengtheningoftheU.S.dollarcomparedtocertainforeigncurrencies.
Therateofchangeinaggregatepaidclicksandaveragecost-per-click,andtheircorrelationwiththerateofchangeinrevenues,
hasuctuatedandmayuctuateinthefuturebecauseofvariousfactors,includingtherevenuegrowthratesonourwebsites
compared to those of our Google Network Members, advertiser competition for keywords, changes in foreign currency exchange
rates, seasonality, the fees advertisers are willing to pay based on how they manage their advertising costs, changes in advertising
qualityorformats,andgeneraleconomicconditions.Inaddition,tracgrowthinemergingmarketscomparedtomoremature
marketsandacrossvariousadvertisingverticalsandchannelsalsocontributestotheseuctuations.Changesinaggregatepaid
clicksandaveragecost-per-clickmaynotbeindicativeofourperformanceoradvertiserexperiencesinanyspecicgeographic
market,vertical,orindustry.
Improvementsinourabilitytomonetizeincreasedtracprimarilyrelatetoenhancingtheenduserexperience,includingproviding
end users with ads that are more relevant to their search queries or to the content on the Google Network Members’ websites
theyvisit.Forinstance,theseimprovementsincludedisplayingadvertiser-nominatedimagesthatarerelevanttotheuserquery
and creating a more engaging user shopping experience by enhancing search ads to include richer product information, such
asproductimage,price,andmerchantname.WebelievethattheincreaseinthenumberofpaidclicksonGooglewebsitesand
Google Network Members’ websites is substantially the result of our commitment to improving the relevance and quality of both
our search results and the advertisements displayed, which we believe results in a better user experience, which in turn results
inmoresearches,advertisers,GoogleNetworkMembersandotherpartners.
Other revenues in our Google segment increased $2,619 million from 2012 to 2013 and also increased as a percentage of the
segmentrevenues.Theincreasewasprimarilyduetogrowthofourdigitalcontentproducts,suchasapps,musicandmovies.
Additionally,weexperiencedanincreaseinourhardwarerevenuesduetoChromecast,directly-soldNexusproductsandChrome
OSdevices.In2011,otherrevenuewasnotasignicantdriverofoverallGooglesegmentrevenues.
OurMotorolaMobilesegmentrevenuesincreased$307millionfrom2012to2013.Theincreasewasduetoapproximatelyseven
months of results being included in 2012 while twelve months of results were included in 2013 and a 14% increase in average
sellingprice(“ASP”)relatedtonewproductlaunchesandchangesinproductmixduringtheyear,partiallyosetbya6%decrease
inunitsshippedduring2013.Wenotethatresultsbetween2012and2013arenotcomparableduetothesignicantrestructuring
eortstosimplifytheproductportfoliocompletedoverthenineteen-monthperiod.
The increase in the Motorola Mobile segment revenues from 2011 to 2012 resulted from the inclusion of revenues from the
MotorolaMobilesegmentof$4,136millionsubsequenttotheacquisitioninMay2012.
contents