Google 2013 Annual Report Download - page 36
Download and view the complete annual report
Please find page 36 of the 2013 Google annual report below. You can navigate through the pages in the report by either clicking on the pages listed below, or by using the keyword search tool below to find specific information within the annual report.-
 1
1 -
2
-
3
-
4
-
5
-
6
-
7
-
8
-
9
-
10
-
11
-
12
-
13
-
14
-
15
-
16
-
17
-
18
-
19
-
20
-
21
-
22
-
23
-
24
-
25
-
 26
26 -
 27
27 -
 28
28 -
 29
29 -
 30
30 -
 31
31 -
 32
32 -
 33
33 -
 34
34 -
 35
35 -
 36
36 -
 37
37 -
 38
38 -
 39
39 -
 40
40 -
 41
41 -
 42
42 -
 43
43 -
 44
44 -
 45
45 -
 46
46 -
47
-
48
-
49
-
50
-
51
-
52
-
53
-
54
-
55
-
56
-
57
-
58
-
59
-
60
-
61
-
62
-
63
-
64
-
65
-
66
-
67
-
68
-
69
-
70
-
71
-
72
-
73
-
74
-
75
-
76
-
77
-
78
-
79
-
80
-
81
-
82
-
83
-
84
-
85
-
86
-
87
-
88
-
89
-
90
-
91
-
92
-
93
-
94
-
95
-
96
 |
 |
30 GOOGLE INC.
PART II
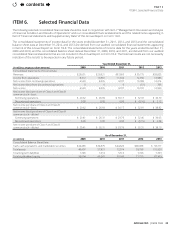
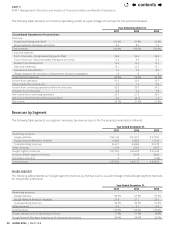
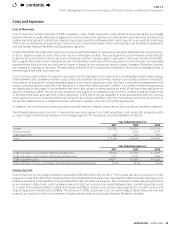
ITEM7.Management’sDiscussionandAnalysisofFinancialConditionandResultsofOperations
CostofrevenuesfortheGooglesegmentincreased$3,877millionfrom2011to2012.Theincreasewasprimarilyrelatedtoan
increaseintracacquisitioncostsof$2,145millionresultingfrommoreadvertiserfeesgeneratedthroughourAdSenseprogram,
moretracdirectedtoourwebsites,aswellasmoredistributionfeespaid.Theremainingincreasewasprimarilydrivenby
increasesindatacentercosts,hardwareinventorycostsandcontentacquisitioncosts.Theincreaseintracacquisitioncostsas
apercentageofadvertisingrevenueswasprimarilytheresultofagreaterincreaseintracacquisitioncostsrelatedtodistribution
arrangementscomparedtotheincreaseinadvertisingrevenuesgeneratedbyGooglewebsites.
Cost of revenues for the Motorola Mobile segment were not comparable between 2012 and 2013 because approximately seven
monthsofresultswereincludedin2012whiletwelvemonthsofresultswereincludedin2013.Additionally,weconductedvarious
restructuringactivitiestosimplifytheMotorolaMobileproductportfoliosubsequenttotheacquisitioninMay2012.
Unallocateditems,includingstock-basedcompensationexpense,aswellasrestructuringandrelatedcharges,arenotallocated
toeachsegmentbecausewedonotincludethisinformationinourmeasurementoftheperformanceofouroperatingsegments.
We expect cost of revenues will increase in dollar amount and may increase as a percentage of total revenues in 2014 and in future
periods,primarilyasaresultofincreasesintracacquisitioncosts,datacentercosts,hardwareandinventorycosts,manufacturing
andinventory-relatedcosts,contentacquisitioncosts,creditcardandothertransactionfees,andothercosts.Tracacquisition
costsasapercentageofadvertisingrevenuesmayuctuateinthefuturebasedonanumberoffactors,includingthefollowing:
TherelativegrowthratesofrevenuesfromourwebsitesandfromourGoogleNetworkMembers’websites.
Whether we are able to enter into more AdSense arrangements that provide for lower revenue share obligations or whether
increased competition for arrangements with existing and potential Google Network Members results in less favorable
revenuesharearrangements.
WhetherweareabletocontinuetoimprovethemonetizationoftraconourwebsitesandourGoogleNetworkMembers’
websites.
The relative growth rates of expenses associated with distribution arrangements and the related revenues generated,
including whether we share with certain existing and new distribution partners proportionately more of the aggregate
advertisingfeesthatweearnfrompaidclicksderivedfromsearchqueriesthesepartnersdirecttoourwebsites.
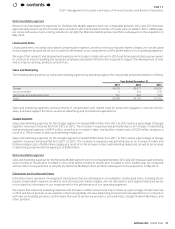
Research and Development
The following table presents our research and development expenses by operating segment for the periods presented
(dollarsinmillions):
Year Ended December31,
2011 2012 2013
Google $4,101 $4,809 $5,496
Motorola Mobile 0 474 702
Unallocated items 1,061 1,510 1,754
Total $5,162 $6,793 $7,952
Research and development expenses consist primarily of compensation and related costs for personnel responsible for the
researchanddevelopmentactivitiesrelatingtonewandexistingproductsandservices,aswellasdepreciationandequipment-
relatedcosts.Weexpenseresearchanddevelopmentcostsasincurred.
Research and development expenses for the Google segment increased $687 million from 2012 to 2013 and as a percentage of
Googlesegmentrevenuesremainedrelativelyatfrom2012to2013.Theincreaseinexpenseswasprimarilyduetoanincrease
inlaborandfacilities-relatedcostsof$596million,largelyasaresultofan18%increaseinresearchanddevelopmentheadcount.
Research and development expenses for the Google segment increased $708 million from 2011 to 2012 and as a percentage of
Googlesegmentrevenuesremainedrelativelyatfrom2011to2012.Theincreaseinexpenseswasprimarilyduetoanincrease
inlaborandfacilities-relatedcostsof$359million,largelyasaresultofa15%increaseinresearchanddevelopmentheadcount,
anincreaseindepreciationandequipment-relatedexpensesof$147million,andanincreaseinprofessionalservicesexpense
of$66million.
contents