Google 2013 Annual Report Download - page 39
Download and view the complete annual report
Please find page 39 of the 2013 Google annual report below. You can navigate through the pages in the report by either clicking on the pages listed below, or by using the keyword search tool below to find specific information within the annual report.-
 1
1 -
2
-
3
-
4
-
5
-
6
-
7
-
8
-
9
-
10
-
11
-
12
-
13
-
14
-
15
-
16
-
17
-
18
-
19
-
20
-
21
-
22
-
23
-
24
-
25
-
26
-
27
-
28
-
 29
29 -
 30
30 -
 31
31 -
 32
32 -
 33
33 -
 34
34 -
 35
35 -
 36
36 -
 37
37 -
 38
38 -
 39
39 -
 40
40 -
 41
41 -
 42
42 -
 43
43 -
 44
44 -
 45
45 -
 46
46 -
 47
47 -
 48
48 -
 49
49 -
50
-
51
-
52
-
53
-
54
-
55
-
56
-
57
-
58
-
59
-
60
-
61
-
62
-
63
-
64
-
65
-
66
-
67
-
68
-
69
-
70
-
71
-
72
-
73
-
74
-
75
-
76
-
77
-
78
-
79
-
80
-
81
-
82
-
83
-
84
-
85
-
86
-
87
-
88
-
89
-
90
-
91
-
92
-
93
-
94
-
95
-
96
 |
 |

33
PART II
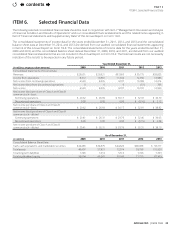
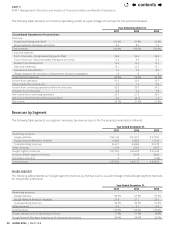
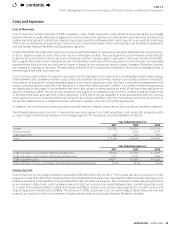
ITEM7.Management’sDiscussionandAnalysisofFinancialConditionandResultsofOperations
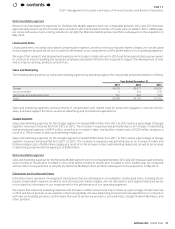
Stock-Based Compensation
Thefollowingtablepresentsourstock-basedcompensationfortheperiodspresented(dollarsinmillions):
Year Ended December31,
2011 2012 2013
Stock-basedcompensation(1) (2) $ 1,974 $ 2,523 $3,247
(1) These amounts are included in the previously discussed sections above, as unallocated items related to cost of revenues, research and
development,salesandmarketing,andgeneralandadministrativeexpenses.
(2) Stock-basedcompensationexpensesof$126millionand$21millionareincludedin“restructuringandrelatedcharges”abovefortheyears
endedDecember31,2012and2013.
Stock-basedcompensationincreased$724millionfrom2012to2013andasapercentageofconsolidatedrevenuesremained
atfrom2012to2013.Thisincreaseinexpenseswasprimarilyduetoanincreaseinheadcounttosupportourgrowingbusiness.
Stock-basedcompensationincreased$549millionfrom2011to2012andasapercentageofconsolidatedrevenuesremainedat
from2011to2012.Thisincreaseinexpenseswasprimarilyduetoadditionalstockawardsissuedtoexistingandnewemployees,
aswellasawardsissuedinconnectionwiththeacquisitionofMotorola.
Stock-basedcompensationexpensefortheMotorolaHomesegmentwasincludedinnetincome(loss)fromdiscontinuedoperations.
Weestimatestock-basedcompensationrelatedtoawardsgrantedthroughDecember31,2013tobeapproximately$3.1billion
in2014and$3.2billionthereafter.Thisestimatedoesnotincludeexpensestoberecognizedrelatedtoemployeestockawards
thataregrantedafterDecember31,2013ornon-employeestockawardsthathavebeenormaybegranted.Inaddition,tothe
extentforfeitureratesaredierentfromwhatwehaveanticipated,stock-basedcompensationrelatedtotheseawardswillbe
dierentfromourexpectations.
Interest and Other Income, Net
Interestandotherincome,net,decreased$96millionfrom2012to2013.Thisdecreasewasprimarilydrivenbyadecreaseinthe
gainondivestitureofbusinesses(otherthanMotorolaHome)of$245millionandadecreaseintherealizedgainoninvestments
of$81million,partiallyosetbyadecreaseinforeigncurrencyexchangelossof$152millionandanincreaseininterestincome
of$72million.
Interestandotherincome,net,increased$42millionfrom2011to2012.Thisincreasewasprimarilydrivenbyagainondivestiture
ofbusinessof$188millionin2012,animpairmentchargerelatedtoequityinvestmentsof$110millionin2011,partiallyoset
byanincreaseinforeigncurrencyexchangelossof$152millionandadecreaseininterestincomeof$99million.
Thecostsofourforeignexchangehedgingactivitiesthatwerecognizedtointerestandotherincome,net,areprimarilyafunction
of the notional amount of the option and forward contracts and their related duration, the movement of the foreign exchange
ratesrelativetothestrikepricesofthecontracts,aswellasthevolatilityoftheforeignexchangerates.
As we expand our international business, we believe costs related to hedging activities under our foreign exchange risk management
programmayincreaseindollaramountin2014andfutureperiods.
Provision for Income Taxes
Thefollowingtablepresentsourprovisionforincometaxes,andeectivetaxratefortheperiodspresented(dollarsinmillions):
Year Ended December31,
2011 2012 2013
Provision for income taxes $2,589 $2,598 $2,282
Eectivetaxrate 21.0% 19.4% 15.7%
ThefederalresearchanddevelopmentcreditexpiredonDecember31,2011.OnJanuary2,2013,theAmericanTaxpayerReliefAct
of2012wassignedintolaw.Underthisact,thefederalresearchanddevelopmentcreditwasretroactivelyextendedforamounts
paidorincurredafterDecember31,2011andbeforeJanuary1,2014.Theeectsofthesechangesinthetaxlawhaveresulted
inataxbenetwhichwasrecognizedintherstquarterof2013,thequarterinwhichthelawwasenacted.
contents