Google 2013 Annual Report Download - page 42
Download and view the complete annual report
Please find page 42 of the 2013 Google annual report below. You can navigate through the pages in the report by either clicking on the pages listed below, or by using the keyword search tool below to find specific information within the annual report.-
 1
1 -
2
-
3
-
4
-
5
-
6
-
7
-
8
-
9
-
10
-
11
-
12
-
13
-
14
-
15
-
16
-
17
-
18
-
19
-
20
-
21
-
22
-
23
-
24
-
25
-
26
-
27
-
28
-
29
-
30
-
31
-
 32
32 -
 33
33 -
 34
34 -
 35
35 -
 36
36 -
 37
37 -
 38
38 -
 39
39 -
 40
40 -
 41
41 -
 42
42 -
 43
43 -
 44
44 -
 45
45 -
 46
46 -
 47
47 -
 48
48 -
 49
49 -
 50
50 -
 51
51 -
 52
52 -
53
-
54
-
55
-
56
-
57
-
58
-
59
-
60
-
61
-
62
-
63
-
64
-
65
-
66
-
67
-
68
-
69
-
70
-
71
-
72
-
73
-
74
-
75
-
76
-
77
-
78
-
79
-
80
-
81
-
82
-
83
-
84
-
85
-
86
-
87
-
88
-
89
-
90
-
91
-
92
-
93
-
94
-
95
-
96
 |
 |
GOOGLE INC.
PART II
ITEM7.Management’sDiscussionandAnalysisofFinancialConditionandResultsofOperations
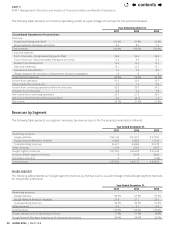
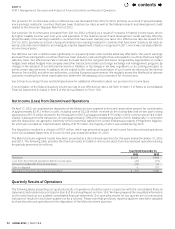
The following table presents our unaudited quarterly results of operations as a percentage of revenues for the eight quarters
ended December 31, 2013:
Quarter Ended
Mar31,
2012
Jun30,
2012
Sep30,
2012
Dec31,
2012
Mar31,
2013
Jun30,
2013
Sep30,
2013
Dec31,
2013
Revenues:
Google (advertising and other) 100.0%92.9%86.6%89.5%92.7%92.9%92.4%93.2%
Motorola Mobile (hardware and other) 0 7.1 13.4 10.5 7.3 7.1 7.6 6.8
Total revenues 100.0%100.0%100.0%100.0%100.0%100.0%100.0%100.0%
Costs and expenses:
Cost of revenues—Google
(advertising and other) 35.6 33.7 33.4 34.4 36.8 36.8 36.3 37.1
Cost of revenues—Motorola Mobile
(hardware and other) 0 5.9 11.3 8.7 5.7 6.2 6.7 7.0
Research and development 13.5 13.0 14.1 13.4 13.2 14.1 13.5 12.5
Sales and marketing 11.9 12.0 12.9 12.2 11.4 12.3 12.1 12.6
General and administrative 7.2 8.0 7.7 7.8 8.0 8.5 8.3 7.5
Total costs and expenses 68.2 72.6 79.4 76.5 75.1 77.9 76.9 76.7
Income from operations 31.8 27.4 20.6 23.5 24.9 22.1 23.1 23.3
Interest and other income, net 1.5 2.1 0.5 1.1 1.0 1.8 0.2 0.7
Income from continuing operations
before income taxes 33.3 29.5 21.1 24.6 25.9 23.9 23.3 24.0
Provision for income taxes 6.2 5.5 4.9 4.4 2.1 5.8 3.4 4.0
Net income from continuing operations 27.1%24.0%16.2%20.2%23.8%18.1%19.9%20.0%
Net income (loss) from discontinued
operations 0% (0.4)% 0.1%(0.2)% 0.2%4.8%0.1% 0%
Net income 27.1%23.6%16.3%20.0%24.0%22.9%20.0%20.0%
Liquidity and Capital Resources
AsofDecember31,2013,wehad$58.7billionofcash,cashequivalents,andmarketablesecurities.Cashequivalentsand
marketable securities are comprised of time deposits, money market and other funds, including cash collateral received related
tooursecuritieslendingprogram,highlyliquiddebtinstrumentsoftheU.S.governmentanditsagencies,debtinstrumentsissued
byforeigngovernments,debtinstrumentsissuedbymunicipalitiesintheU.S.,corporatesecurities,mortgage-backedsecurities
andasset-backedsecurities.
AsofDecember31,2013,$33.6billionofthe$58.7billionofcash,cashequivalents,andmarketablesecuritieswasheldbyour
foreignsubsidiaries.IfthesefundsareneededforouroperationsintheU.S.,wewouldberequiredtoaccrueandpayU.S.taxes
torepatriatethesefunds.However,ourintentistopermanentlyreinvestthesefundsoutsideoftheU.S.andourcurrentplans
donotdemonstrateaneedtorepatriatethemtofundourU.S.operations.
Ourprincipalsourcesofliquidityareourcash,cashequivalents,andmarketablesecurities,aswellasthecashowthatwegenerate
fromouroperations.AtDecember31,2013,wehadunusedlettersofcreditforapproximately$173million.Webelievethatour
sourcesoffundingwillbesucienttosatisfyourcurrentlyanticipatedcashrequirementsthroughatleastthenext12months.
Ourliquiditycouldbenegativelyaectedbyadecreaseindemandforourproductsandservices.Inaddition,wemaymake
acquisitions or license products and technologies complementary to our business and may need to raise additional capital through
futuredebtorequitynancingtoprovideforgreaterexibilitytofundanysuchacquisitionsandlicensingactivities.Additional
nancingmaynotbeavailableatallorontermsfavorabletous.
Wehaveadebtnancingprogramofupto$3.0billionthroughtheissuanceofcommercialpaper.Netproceedsfromthis
programareusedforgeneralcorporatepurposes.AsofDecember31,2013,wehad$2.0billionofcommercialpaperoutstanding
recordedasshort-termdebt,withaweighted-averageinterestrateof0.1%thatmatureatvariousdatesthroughJune2014.
Averagecommercialpaperborrowingsduringtheyearwere$2.1billionandthemaximumamountoutstandingduringtheyear
was$2.5billion.Inconjunctionwiththisprogram,wehavea$3.0billionrevolvingcreditfacilityexpiringinJuly2016.Theinterest
rateforthecreditfacilityisdeterminedbasedonaformulausingcertainmarketrates.AsofDecember31,2013,wewerein
compliancewiththenancialcovenantinthecreditfacilityandnoamountswereoutstanding.
InMay2011,weissued$3.0billionofunsecuredseniornotesinthreeequaltranches,duein2014,2016,and2021,withstated
interestratesof1.25%,2.125%,and3.625%.Thenetproceedsfromthesaleofthenoteswereusedtorepayaportionofour
outstandingcommercialpaperandforgeneralcorporatepurposes.InMay2013,wereclassiedthersttrancheof$1.0billion
unsecuredseniornotesdueinMay2014asshort-termdebt.Weplantoissue$1.0billionoflong-termdebtwhenthisnote
maturesin2014.AsofDecember31,2013,thetotalcarryingvalueandestimatedfairvalueofthesenoteswere$3.0billionand
contents