Google 2013 Annual Report Download - page 41
Download and view the complete annual report
Please find page 41 of the 2013 Google annual report below. You can navigate through the pages in the report by either clicking on the pages listed below, or by using the keyword search tool below to find specific information within the annual report.-
 1
1 -
2
-
3
-
4
-
5
-
6
-
7
-
8
-
9
-
10
-
11
-
12
-
13
-
14
-
15
-
16
-
17
-
18
-
19
-
20
-
21
-
22
-
23
-
24
-
25
-
26
-
27
-
28
-
29
-
30
-
 31
31 -
 32
32 -
 33
33 -
 34
34 -
 35
35 -
 36
36 -
 37
37 -
 38
38 -
 39
39 -
 40
40 -
 41
41 -
 42
42 -
 43
43 -
 44
44 -
 45
45 -
 46
46 -
 47
47 -
 48
48 -
 49
49 -
 50
50 -
 51
51 -
52
-
53
-
54
-
55
-
56
-
57
-
58
-
59
-
60
-
61
-
62
-
63
-
64
-
65
-
66
-
67
-
68
-
69
-
70
-
71
-
72
-
73
-
74
-
75
-
76
-
77
-
78
-
79
-
80
-
81
-
82
-
83
-
84
-
85
-
86
-
87
-
88
-
89
-
90
-
91
-
92
-
93
-
94
-
95
-
96
 |
 |

PART II
ITEM7.Management’sDiscussionandAnalysisofFinancialConditionandResultsofOperations
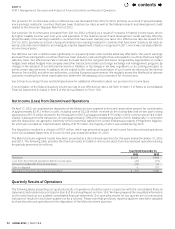
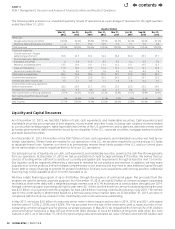
ThefollowingtablepresentsourunauditedquarterlyresultsofoperationsfortheeightquartersendedDecember31,2013.This
tableincludesalladjustments,consistingonlyofnormalrecurringadjustments,thatweconsidernecessaryforfairpresentation
ofourconsolidatednancialpositionandoperatingresultsforthequarterspresented.Bothseasonaluctuationsininternet
usageandtraditionalretailseasonalityhaveaected,andarelikelytocontinuetoaect,ourbusiness.Internetusagegenerally
slowsduringthesummermonths,andcommercialqueriestypicallyincreasesignicantlyinthefourthquarterofeachyear.
Theseseasonaltrendshavecausedandwilllikelycontinuetocause,uctuationsinourquarterlyresults,includinguctuations
insequentialrevenuegrowthrates.
Quarter Ended
Mar31,
2012
Jun30,
2012
Sep30,
2012
Dec31,
2012
Mar31,
2013
Jun30,
2013
Sep30,
2013
Dec31,
2013
(In millions, except per share amounts)
(unaudited)
Consolidated Statements of Income Data:
Revenues:
Google (advertising and other) $10,645 $10,964 $11,526 $12,905 $12,951 $13,107 $13,754 $15,707
Motorola Mobile (hardware and other) 0 843 1,778 1,514 1,018 998 1,139 1,151
Total revenues 10,645 11,807 13,304 14,419 13,969 14,105 14,893 16,858
Costs and expenses:
Cost of revenues—Google
(advertising and other) 3,789 3,984 4,440 4,963 5,136 5,195 5,409 6,253
Cost of revenues—Motorola Mobile
(hardware and other) 0 693 1,515 1,250 808 868 1,004 1,185
Research and development 1,441 1,538 1,879 1,935 1,837 1,987 2,017 2,111
Sales and marketing 1,269 1,413 1,710 1,751 1,586 1,735 1,806 2,126
General and administrative 757 942 1,020 1,126 1,125 1,197 1,213 1,261
Total costs and expenses 7,256 8,570 10,564 11,025 10,492 10,982 11,449 12,936
Income from operations 3,389 3,237 2,740 3,394 3,477 3,123 3,444 3,922
Interest and other income, net 156 253 65 152 134 247 24 125
Income from continuing operations
before income taxes 3,545 3,490 2,805 3,546 3,611 3,370 3,468 4,047
Provision for income taxes 655 657 647 639 287 816 513 666
Net income from continuing operations $ 2,890 $ 2,833 $ 2,158 $ 2,907 $ 3,324 $ 2,554 $ 2,955 $ 3,381
Net income (loss) from discontinued
operations 0 (48) 18 (21) 22 674 15 (5)
Net income $ 2,890 $2,785 $2,176 $2,886 $3,346 $3,228 $2,970 $3,376
Net income (loss) per share—basic:
Continuing operations $ 8.88 $8.68 $6.59 $8.83 $ 10.06 $7.68 $ 8.86 $10.10
Discontinued operations 0 (0.14) 0.05 $(0.06) $ 0.07 $2.03 $0.04 $(0.02)
Net income per share—basic $ 8.88 $8.54 $6.64 $8.77 $10.13 $9.71 $8.90 $10.08
Net income (loss) per share—diluted:
Continuing operations $ 8.75 $8.56 $6.48 $8.68 $ 9.87 $7.55 $ 8.71 $9.91
Discontinued operations 0 (0.14) 0.05 (0.06 ) 0.07 1.99 0.04 (0.01)
Net income per share—diluted $ 8.75 $8.42 $6.53 $8.62 $9.94 $9.54 $8.75 $9.90
contents