Google 2013 Annual Report Download - page 77
Download and view the complete annual report
Please find page 77 of the 2013 Google annual report below. You can navigate through the pages in the report by either clicking on the pages listed below, or by using the keyword search tool below to find specific information within the annual report.-
 1
1 -
2
-
3
-
4
-
5
-
6
-
7
-
8
-
9
-
10
-
11
-
12
-
13
-
14
-
15
-
16
-
17
-
18
-
19
-
20
-
21
-
22
-
23
-
24
-
25
-
26
-
27
-
28
-
29
-
30
-
31
-
32
-
33
-
34
-
35
-
36
-
37
-
38
-
39
-
40
-
41
-
42
-
43
-
44
-
45
-
46
-
47
-
48
-
49
-
50
-
51
-
52
-
53
-
54
-
55
-
56
-
57
-
58
-
59
-
60
-
61
-
62
-
63
-
64
-
65
-
66
-
 67
67 -
 68
68 -
 69
69 -
 70
70 -
 71
71 -
 72
72 -
 73
73 -
 74
74 -
 75
75 -
 76
76 -
 77
77 -
 78
78 -
 79
79 -
 80
80 -
 81
81 -
 82
82 -
 83
83 -
 84
84 -
 85
85 -
 86
86 -
 87
87 -
88
-
89
-
90
-
91
-
92
-
93
-
94
-
95
-
96
 |
 |

PART II
ITEM8.Notes to Consolidated Financial Statements
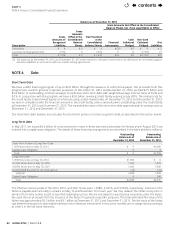
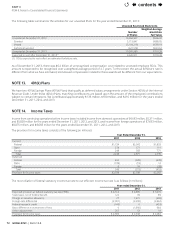
ThefollowingtablesummarizestheactivitiesforouroptionsfortheyearendedDecember31,2013:
Options Outstanding
Number
of Shares
Weighted-
Average
Exercise Price
Weighted-Average
Remaining Contractual
Term (in years)
Aggregate
Intrinsic Value
(in millions)(1)
BalanceatDecember31,2012 8,551,395 $405.98
Granted 1,571 $723.25
Exercised (3,299,276) $355.56
Forfeited/canceled (220,827) $595.92
BalanceatDecember31,2013 5,032,863 $431.00 5.0 $3,470
ExercisableasofDecember31,2013 3,795,911 $379.60 4.1 $2,813
ExercisableasofDecember31,2013andexpectedto
vestthereafter(2) 4,880,718 $426.33 5.0 $3,390
(1) Theaggregateintrinsicvalueiscalculatedasthedifferencebetweentheexercisepriceoftheunderlyingawardsandtheclosingstockprice
of$1,120.71ofourClassAcommonstockonDecember31,2013.
(2) Optionsexpectedtovestreflectanestimatedforfeiturerate.
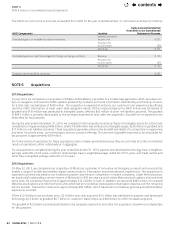
Thefollowingtablesummarizesadditionalinformationregardingoutstanding,andvestedandexercisablestockoptionsasof
December31,2013:
Range of
ExercisePrices
Options Outstanding Options Exercisable
Number
of Shares
Weighted-
Average
Remaining Life
(in years)
Weighted-Average
Exercise Price Number of Shares
Weighted-Average
Exercise Price
$3.75–$92.23 22,905 2.2 $68.89 22,905 $ 68.89
$117.84–$198.41 117,075 1.1 $181.44 117,075 $ 181.44
$205.96–$298.86 141,731 1.6 $276.29 141,731 $ 276.29
$300.97–$399.00 2,098,774 3.5 $309.82 2,066,572 $309.83
$401.78–$499.07 547,762 5.1 $442.23 516,010 $440.83
$501.27–$595.35 1,235,007 6.2 $538.95 755,917 $ 532.34
$601.17–$675.82 852,625 7.9 $628.88 172,006 $616.14
$723.25–$762.5 16,984 8.8 $758.87 3,695 $758.34
$3.75–$762.5 5,032,863 5.0 $431.00 3,795,911 $ 379.60
Theabovetablesinclude388,324warrantsheldbyselectednancialinstitutionsthatwereoptionspurchasedfrom
employeesunderourTSOprogram,withaweighted-averageexercisepriceof$431.76andaweighted-averageremaining
lifeof0.6years.
During2013,thenumberofsharesunderlyingTSOssoldtoselectednancialinstitutionsundertheTSOprogramwas671,190
atatotalvalueof$322million,oranaverageof$479.06pershare,includinganaveragepremiumof$2.35pershare.The
premiumiscalculatedasthedierencebetween(a)thesalepriceoftheTSOand(b)theintrinsicvalueoftheTSO,which
wedeneastheexcess,ifany,ofthepriceofourClassAcommonstockatthetimeofthesaleovertheexercisepriceof
theTSO.TheTSOprogramwasdiscontinuedasofNovember29,2013.Thisdidnothaveamaterialimpactonourconsolidated
nancialstatements.
Thetotalgrantdatefairvalueofstockoptionsvestedduring2011,2012,and2013was$561million,$489million,and$223million.
Theaggregateintrinsicvalueofalloptionsandwarrantsexercisedduring2011,2012,and2013was$674million,$827million,
and$1,793million.TheseamountsdonotincludetheaggregatesalespriceofoptionssoldunderourTSOprogram.
AsofDecember31,2013,therewas$188millionofunrecognizedcompensationcostrelatedtooutstandingemployeestock
options.Thisamountisexpectedtoberecognizedoveraweighted-averageperiodof1.9years.Totheextenttheactual
forfeiturerateisdierentfromwhatwehaveestimated,stock-basedcompensationrelatedtotheseawardswillbedierent
fromourexpectations.
contents