Google 2013 Annual Report Download - page 62
Download and view the complete annual report
Please find page 62 of the 2013 Google annual report below. You can navigate through the pages in the report by either clicking on the pages listed below, or by using the keyword search tool below to find specific information within the annual report.-
 1
1 -
2
-
3
-
4
-
5
-
6
-
7
-
8
-
9
-
10
-
11
-
12
-
13
-
14
-
15
-
16
-
17
-
18
-
19
-
20
-
21
-
22
-
23
-
24
-
25
-
26
-
27
-
28
-
29
-
30
-
31
-
32
-
33
-
34
-
35
-
36
-
37
-
38
-
39
-
40
-
41
-
42
-
43
-
44
-
45
-
46
-
47
-
48
-
49
-
50
-
51
-
 52
52 -
 53
53 -
 54
54 -
 55
55 -
 56
56 -
 57
57 -
 58
58 -
 59
59 -
 60
60 -
 61
61 -
 62
62 -
 63
63 -
 64
64 -
 65
65 -
 66
66 -
 67
67 -
 68
68 -
 69
69 -
 70
70 -
 71
71 -
 72
72 -
73
-
74
-
75
-
76
-
77
-
78
-
79
-
80
-
81
-
82
-
83
-
84
-
85
-
86
-
87
-
88
-
89
-
90
-
91
-
92
-
93
-
94
-
95
-
96
 |
 |

56 GOOGLE INC.
PART II
ITEM8.NotestoConsolidatedFinancialStatements
Financial Instruments
Fair Value Measurements
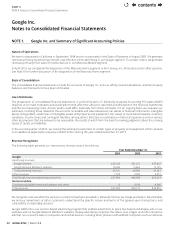
Wemeasureourcashequivalents,marketablesecurities,andforeigncurrencyandinterestratederivativecontractsatfairvalue
onarecurringbasis.Fairvalueisanexitprice,representingtheamountthatwouldbereceivedtosellanassetorpaidtotransfer
aliabilityinanorderlytransactionbetweenmarketparticipants.Assuch,fairvalueisamarket-basedmeasurementthatshould
bedeterminedbasedonassumptionsthatmarketparticipantswoulduseinpricinganassetoraliability.Assetsandliabilities
recordedatfairvaluearemeasuredandclassiedinaccordancewithathree-tierfairvaluehierarchybasedontheobservability
oftheinputsavailableinthemarketusedtomeasurefairvalue:
Level1—Observableinputsthatreectquotedprices(unadjusted)foridenticalassetsorliabilitiesinactivemarkets.
Level2—Includeotherinputsthatarebaseduponquotedpricesforsimilarinstrumentsinactivemarkets,quotedpricesfor
identicalorsimilarinstrumentsinmarketsthatarenotactive,andmodel-basedvaluationtechniquesforwhichallsignicant
inputsareobservableinthemarketorcanbederivedfromobservablemarketdata.Whereapplicable,thesemodelsproject
futurecashowsanddiscountthefutureamountstoapresentvalueusingmarket-basedobservableinputsincludinginterest
ratecurves,foreignexchangerates,andcreditratings.
Level3—Unobservableinputsthataresupportedbylittleornomarketactivities.
Thefairvaluehierarchyrequiresanentitytomaximizetheuseofobservableinputsandminimizetheuseofunobservableinputs
whenmeasuringfairvalue.
WeclassifyourcashequivalentsandmarketablesecuritieswithinLevel1orLevel2becauseweusequotedmarketpricesor
alternativepricingsourcesandmodelsutilizingmarketobservableinputstodeterminetheirfairvalue.Weclassifyourforeign
currencyandinterestratederivativecontractsprimarilywithinLevel2asthevaluationinputsarebasedonquotedpricesand
marketobservabledataofsimilarinstruments.
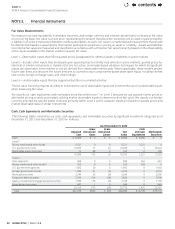
Cash, Cash Equivalents and Marketable Securities
Thefollowingtablessummarizeourcash,cashequivalentsandmarketablesecuritiesbysignicantinvestmentcategoriesasof
December31,2012andDecember31,2013(inmillions):
As of December31, 2012
Adjusted
Cost
Gross
Unrealized
Gains
Gross
Unrealized
Losses
Fair
Value
Cash
and Cash
Equivalents
Marketable
Securities
Cash $8,066 $0$0$8,066 $8,066 $0
Level1:
Moneymarketandotherfunds 5,221 0 0 5,221 5,221 0
U.S.governmentnotes 10,853 77 (1) 10,929 0 10,929
Marketableequitysecurities 12 88 0 100 0 100
16,086 165 (1) 16,250 5,221 11,029
Level2:
Timedeposits(1) 984 0 0 984 562 422
Moneymarketandotherfunds(2) 929 0 0 929 929 0
U.S.governmentagencies 1,882 20 0 1,902 0 1,902
Foreigngovernmentbonds 1,996 81 (3) 2,074 0 2,074
Municipal securities 2,249 23 (6) 2,266 0 2,266
Corporatedebtsecurities 7,200 414 (14) 7,600 0 7,600
Agencyresidentialmortgage-backedsecurities 7,039 136 (6) 7,169 0 7,169
Asset-backedsecurities 847 1 0 848 0 848
23,126 675 (29) 23,772 1,491 22,281
Total $47,278 $840 $(30) $48,088 $14,778 $33,310
contents