GameStop 2007 Annual Report Download - page 98
Download and view the complete annual report
Please find page 98 of the 2007 GameStop annual report below. You can navigate through the pages in the report by either clicking on the pages listed below, or by using the keyword search tool below to find specific information within the annual report.-
 1
1 -
2
-
3
-
4
-
5
-
6
-
7
-
8
-
9
-
10
-
11
-
12
-
13
-
14
-
15
-
16
-
17
-
18
-
19
-
20
-
21
-
22
-
23
-
24
-
25
-
26
-
27
-
28
-
29
-
30
-
31
-
32
-
33
-
34
-
35
-
36
-
37
-
38
-
39
-
40
-
41
-
42
-
43
-
44
-
45
-
46
-
47
-
48
-
49
-
50
-
51
-
52
-
53
-
54
-
55
-
56
-
57
-
58
-
59
-
60
-
61
-
62
-
63
-
64
-
65
-
66
-
67
-
68
-
69
-
70
-
71
-
72
-
73
-
74
-
75
-
76
-
77
-
78
-
79
-
80
-
81
-
82
-
83
-
84
-
85
-
86
-
87
-
 88
88 -
 89
89 -
 90
90 -
 91
91 -
 92
92 -
 93
93 -
 94
94 -
 95
95 -
 96
96 -
 97
97 -
 98
98 -
 99
99 -
 100
100 -
 101
101 -
 102
102 -
 103
103 -
 104
104 -
 105
105 -
 106
106 -
 107
107 -
 108
108 -
109
-
110
-
111
-
112
-
113
-
114
-
115
 |
 |

52 weeks ended February 2, 2008, the 53 weeks ended February 3, 2007 and the 52 weeks ended January 28, 2006,
these charges amounted to $1,221, $996 and $857, respectively.
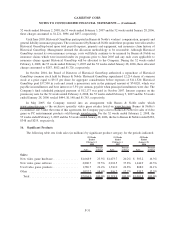
Until June 2005, Historical GameStop participated in Barnes & Noble’s workers’ compensation, property and
general liability insurance programs. The costs incurred by Barnes & Noble under these programs were allocated to
Historical GameStop based upon total payroll expense, property and equipment, and insurance claim history of
Historical GameStop. Management deemed the allocation methodology to be reasonable. Although Historical
GameStop secured its own insurance coverage, costs will likely continue to be incurred by Barnes & Noble on
insurance claims which were incurred under its programs prior to June 2005 and any such costs applicable to
insurance claims against Historical GameStop will be allocated to the Company. During the 52 weeks ended
February 2, 2008, the 53 weeks ended February 3, 2007 and the 52 weeks ended January 28, 2006, these allocated
charges amounted to $287, $812 and $1,726, respectively.
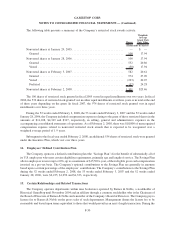
In October 2004, the Board of Directors of Historical GameStop authorized a repurchase of Historical
GameStop common stock held by Barnes & Noble. Historical GameStop repurchased 12,214 shares of common
stock at a price equal to $9.13 per share for aggregate consideration before expenses of $111,520. Historical
GameStop paid $37,500 in cash and issued a promissory note in the principal amount of $74,020, which was
payable in installments and bore interest at 5.5% per annum, payable when principal installments were due. The
Company’s final scheduled principal payment of $12,173 was paid in October 2007. Interest expense on the
promissory note for the 52 weeks ended February 2, 2008, the 53 weeks ended February 3, 2007 and the 52 weeks
ended January 28, 2006 totaled $444, $1,148 and $1,785, respectively.
In May 2005, the Company entered into an arrangement with Barnes & Noble under which
www.gamestop.com is the exclusive specialty video game retailer listed on www.bn.com, Barnes & Noble’s
e-commerce site. Under the terms of this agreement, the Company pays a fee to Barnes & Noble for sales of video
game or PC entertainment products sold through www.bn.com. For the 52 weeks ended February 2, 2008, the
53 weeks ended February 3, 2007 and the 52 weeks ended January 28, 2006, the fee to Barnes & Noble totaled $382,
$348 and $255, respectively.
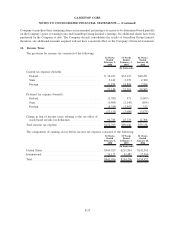
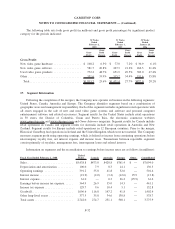
16. Significant Products
The following table sets forth sales (in millions) by significant product category for the periods indicated:
Sales
Percent
of Total Sales
Percent
of Total Sales
Percent
of Total
52 Weeks
Ended
February 2,
2008
53 Weeks
Ended
February 3,
2007
52 Weeks
Ended
January 28,
2006
Sales:
New video game hardware................ $1,668.9 23.5% $1,073.7 20.2% $ 503.2 16.3%
New video game software ................ 2,800.7 39.5% 2,012.5 37.8% 1,244.9 40.3%
Used video game products ................ 1,586.7 22.4% 1,316.0 24.8% 808.0 26.1%
Other ............................... 1,037.7 14.6% 916.7 17.2% 535.7 17.3%
Total .............................. $7,094.0 100.0% $5,318.9 100.0% $3,091.8 100.0%
F-31
GAMESTOP CORP.
NOTES TO CONSOLIDATED FINANCIAL STATEMENTS — (Continued)