GameStop 2007 Annual Report Download - page 39
Download and view the complete annual report
Please find page 39 of the 2007 GameStop annual report below. You can navigate through the pages in the report by either clicking on the pages listed below, or by using the keyword search tool below to find specific information within the annual report.-
 1
1 -
2
-
3
-
4
-
5
-
6
-
7
-
8
-
9
-
10
-
11
-
12
-
13
-
14
-
15
-
16
-
17
-
18
-
19
-
20
-
21
-
22
-
23
-
24
-
25
-
26
-
27
-
28
-
 29
29 -
 30
30 -
 31
31 -
 32
32 -
 33
33 -
 34
34 -
 35
35 -
 36
36 -
 37
37 -
 38
38 -
 39
39 -
 40
40 -
 41
41 -
 42
42 -
 43
43 -
 44
44 -
 45
45 -
 46
46 -
 47
47 -
 48
48 -
 49
49 -
50
-
51
-
52
-
53
-
54
-
55
-
56
-
57
-
58
-
59
-
60
-
61
-
62
-
63
-
64
-
65
-
66
-
67
-
68
-
69
-
70
-
71
-
72
-
73
-
74
-
75
-
76
-
77
-
78
-
79
-
80
-
81
-
82
-
83
-
84
-
85
-
86
-
87
-
88
-
89
-
90
-
91
-
92
-
93
-
94
-
95
-
96
-
97
-
98
-
99
-
100
-
101
-
102
-
103
-
104
-
105
-
106
-
107
-
108
-
109
-
110
-
111
-
112
-
113
-
114
-
115
 |
 |

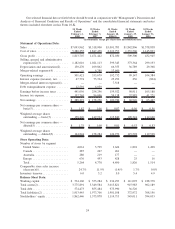
Our selected financial data set forth below should be read in conjunction with “Management’s Discussion and
Analysis of Financial Condition and Results of Operations” and the consolidated financial statements and notes
thereto included elsewhere in this Form 10-K.
52 Weeks
Ended
February 2,
2008
53 Weeks
Ended
February 3,
2007
52 Weeks
Ended
January 28,
2006(1)
52 Weeks
Ended
January 29,
2005
52 Weeks
Ended
January 31,
2004
(In thousands, except per share data and statistical data)
Statement of Operations Data:
Sales ......................... $7,093,962 $5,318,900 $3,091,783 $1,842,806 $1,578,838
Cost of sales .................... 5,280,255 3,847,458 2,219,753 1,333,506 1,145,893
Gross profit .................... 1,813,707 1,471,442 872,030 509,300 432,945
Selling, general and administrative
expenses(2)(3)................. 1,182,016 1,021,113 599,343 373,364 299,193
Depreciation and amortization(2) ..... 130,270 109,862 66,355 36,789 29,368
Merger-related expenses(4) ......... — 6,788 13,600 — —
Operating earnings . . ............. 501,421 333,679 192,732 99,147 104,384
Interest expense (income), net ....... 47,774 73,324 25,292 236 (804)
Merger-related interest expense(4) .... — — 7,518 — —
Debt extinguishment expense ....... 12,591 6,059 — — —
Earnings before income taxes ....... 441,056 254,296 159,922 98,911 105,188
Income tax expense. . ............. 152,765 96,046 59,138 37,985 41,721
Net earnings .................... $ 288,291 $ 158,250 $ 100,784 $ 60,926 $ 63,467
Net earnings per common share —
basic(5)...................... $ 1.82 $ 1.06 $ 0.87 $ 0.56 $ 0.56
Weighted average shares
outstanding — basic(5) .......... 158,226 149,924 115,840 109,324 112,660
Net earnings per common share —
diluted(5) .................... $ 1.75 $ 1.00 $ 0.81 $ 0.53 $ 0.53
Weighted average shares
outstanding — diluted(5) ......... 164,844 158,284 124,972 115,592 119,528
Store Operating Data:
Number of stores by segment
United States.................. 4,061 3,799 3,624 1,801 1,498
Canada ...................... 287 267 261 — —
Australia ..................... 280 219 177 — —
Europe ...................... 636 493 428 25 16
Total ........................ 5,264 4,778 4,490 1,826 1,514
Comparable store sales increase
(decrease)(6) .................. 24.7% 11.9% (1.4)% 1.7% 0.8%
Inventory turnover................ 6.0 5.2 5.0 5.4 4.9
Balance Sheet Data:
Working capital ................. $ 534,160 $ 353,284 $ 234,293 $ 111,093 $ 188,378
Total assets(2)................... 3,775,891 3,349,584 3,015,821 915,983 902,189
Total debt ...................... 574,473 855,484 975,990 36,520 —
Total liabilities(2) . . . ............. 1,913,445 1,973,706 1,901,108 372,972 308,156
Stockholders’ equity .............. 1,862,446 1,375,878 1,114,713 543,011 594,033
24