GameStop 2007 Annual Report Download - page 48
Download and view the complete annual report
Please find page 48 of the 2007 GameStop annual report below. You can navigate through the pages in the report by either clicking on the pages listed below, or by using the keyword search tool below to find specific information within the annual report.-
 1
1 -
2
-
3
-
4
-
5
-
6
-
7
-
8
-
9
-
10
-
11
-
12
-
13
-
14
-
15
-
16
-
17
-
18
-
19
-
20
-
21
-
22
-
23
-
24
-
25
-
26
-
27
-
28
-
29
-
30
-
31
-
32
-
33
-
34
-
35
-
36
-
37
-
 38
38 -
 39
39 -
 40
40 -
 41
41 -
 42
42 -
 43
43 -
 44
44 -
 45
45 -
 46
46 -
 47
47 -
 48
48 -
 49
49 -
 50
50 -
 51
51 -
 52
52 -
 53
53 -
 54
54 -
 55
55 -
 56
56 -
 57
57 -
 58
58 -
59
-
60
-
61
-
62
-
63
-
64
-
65
-
66
-
67
-
68
-
69
-
70
-
71
-
72
-
73
-
74
-
75
-
76
-
77
-
78
-
79
-
80
-
81
-
82
-
83
-
84
-
85
-
86
-
87
-
88
-
89
-
90
-
91
-
92
-
93
-
94
-
95
-
96
-
97
-
98
-
99
-
100
-
101
-
102
-
103
-
104
-
105
-
106
-
107
-
108
-
109
-
110
-
111
-
112
-
113
-
114
-
115
 |
 |
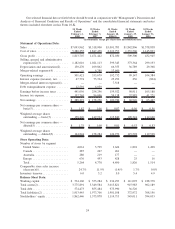
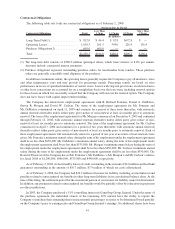
to debt retirement and the recognition of deferred financing fees and unamortized original issue discount. Debt
extinguishment expense of $6.1 million was incurred in fiscal 2006 for the loss associated with the Company’s
repurchase of $50.0 million of its senior notes payable and $50.0 million of its senior floating rate notes payable.
Income tax expense increased by $56.8 million, from $96.0 million in fiscal 2006 to $152.8 million in fiscal
2007. The Company’s effective tax rate decreased from 37.8% in fiscal 2006 to 34.6% in fiscal 2007 due to the
release of foreign valuation allowances on net operating losses and the recognition of foreign tax credits not
previously benefited. See Note 12 of “Notes to Consolidated Financial Statements” for additional information
regarding income taxes.
The factors described above led to an increase in operating earnings of $167.7 million, or 50.3%, from
$333.7 million in fiscal 2006 to $501.4 million in fiscal 2007 and an increase in net earnings of $130.0 million, or
82.1%, from $158.3 million in fiscal 2006 to $288.3 million in fiscal 2007.
Fiscal 2006 Compared to Fiscal 2005
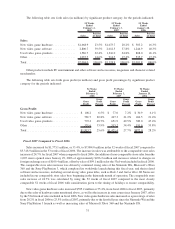
Sales increased by $2,227.1 million, or 72.0%, to $5,318.9 million in the 53 weeks of fiscal 2006 compared to
$3,091.8 million in the 52 weeks of fiscal 2005. Sales for the 53rd week included in fiscal 2006 were $99.1 million.
The remaining increase in sales was attributable to approximately $1,408.4 million of sales in EB stores in fiscal
2006 prior to the anniversary of the mergers, approximately $247.1 million in non-comparable store sales resulting
from the approximately 800 new GameStop stores opened since January 29, 2005, with the remaining increase of
$472.5 million due primarily to an increase in comparable store sales. The comparable store sales increase was
11.9% on a pro forma basis for fiscal 2006 when compared to fiscal 2005 and was expected due to the launch of the
Sony PlayStation 3 and the Nintendo Wii in November 2006. Stores are included in our comparable store sales base
beginning in the thirteenth month of operation. The pro forma comparable store sales increase of 11.9% was
calculated by using the first 52 weeks of fiscal 2006 compared to the 52 weeks in fiscal 2005.
New video game hardware sales increased $570.5 million or 113.4%, from fiscal 2005 to fiscal 2006, primarily
due to the mergers, the 53rd week of sales included in fiscal 2006 and the launches of Microsoft Xbox 360 in
November 2005 and the Sony Playstation 3 and the Nintendo Wii in November 2006. New hardware sales increased
as a percentage of sales from 16.3% in fiscal 2005 to 20.2% in fiscal 2006 due primarily to the first full year since the
Microsoft Xbox 360 launch and due to the launches of the new platforms in 2006. New video game software sales
also increased $767.6 million, or 61.7%, from fiscal 2005 to fiscal 2006, primarily due to the mergers, the 53rd week
of sales in fiscal 2006 and a strong lineup of new video game titles. New software sales as a percentage of total sales
decreased from 40.3% in fiscal 2005 to 37.8% in fiscal 2006 due to the increase in new hardware sales as a
percentage of total sales. Used video game product sales also grew due to the mergers, the 53rd week of sales in
fiscal 2006 and the increase in store count, with an increase in sales of $508.0 million, or 62.9%, from fiscal 2005.
Sales of other product categories, including PC entertainment and other software and accessories, magazines and
trading cards, grew 71.1%, or $381.0 million, from fiscal 2005 to fiscal 2006, primarily due to the mergers and the
53rd week of sales in fiscal 2006.
Cost of sales increased by $1,627.7 million, or 73.3%, from $2,219.8 million in fiscal 2005 to $3,847.5 million
in fiscal 2006 as a result of the mergers, the 53rd week of sales in fiscal 2006 and the changes in gross profit
discussed below.
Gross profit increased by $599.4 million, or 68.7%, from $872.0 million in fiscal 2005 to $1,471.4 million in
fiscal 2006. Gross profit as a percentage of sales decreased from 28.2% in fiscal 2005 to 27.7% in fiscal 2006. This
decrease was primarily due to the increase in hardware sales as a percentage of total sales. New hardware sales carry
a lower overall gross profit compared to other sales categories. The increase in hardware sales was driven by new
product launches in fiscal 2006. The gross profit on new hardware increased from 6.1% of sales in fiscal 2005 to
7.2% in fiscal 2006 due to an emphasis on selling product replacement plans along with hardware platforms. Gross
profit as a percentage of sales on new software remained comparable at 21.4% in fiscal 2005 and 21.2% in fiscal
2006. Gross profit as a percentage of sales on other products decreased from 35.8% in fiscal 2005 to 34.4% in fiscal
2006 due to a shift in sales to lower margin products within the other product categories. Gross profit as a percentage
of sales on used video game products increased from 47.4% in fiscal 2005 to 49.5% in fiscal 2006 due to increased
33