GameStop 2007 Annual Report Download - page 103
Download and view the complete annual report
Please find page 103 of the 2007 GameStop annual report below. You can navigate through the pages in the report by either clicking on the pages listed below, or by using the keyword search tool below to find specific information within the annual report.-
 1
1 -
2
-
3
-
4
-
5
-
6
-
7
-
8
-
9
-
10
-
11
-
12
-
13
-
14
-
15
-
16
-
17
-
18
-
19
-
20
-
21
-
22
-
23
-
24
-
25
-
26
-
27
-
28
-
29
-
30
-
31
-
32
-
33
-
34
-
35
-
36
-
37
-
38
-
39
-
40
-
41
-
42
-
43
-
44
-
45
-
46
-
47
-
48
-
49
-
50
-
51
-
52
-
53
-
54
-
55
-
56
-
57
-
58
-
59
-
60
-
61
-
62
-
63
-
64
-
65
-
66
-
67
-
68
-
69
-
70
-
71
-
72
-
73
-
74
-
75
-
76
-
77
-
78
-
79
-
80
-
81
-
82
-
83
-
84
-
85
-
86
-
87
-
88
-
89
-
90
-
91
-
92
-
 93
93 -
 94
94 -
 95
95 -
 96
96 -
 97
97 -
 98
98 -
 99
99 -
 100
100 -
 101
101 -
 102
102 -
 103
103 -
 104
104 -
 105
105 -
 106
106 -
 107
107 -
 108
108 -
 109
109 -
 110
110 -
 111
111 -
 112
112 -
 113
113 -
114
-
115
 |
 |

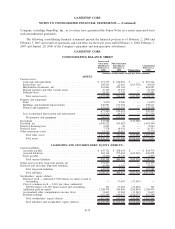
GAMESTOP CORP.
CONSOLIDATING BALANCE SHEET
Issuers and
Guarantor
Subsidiaries
February 3,
2007
Non-Guarantor
Subsidiaries
February 3,
2007 Eliminations
Consolidated
February 3,
2007
(Amounts in thousands, except per share amounts)
ASSETS:
Current assets:
Cash and cash equivalents . . ....................... $ 582,514 $ 69,889 $ — $ 652,403
Receivables, net . . . ............................. 51,978 9,010 (26,720) 34,268
Merchandise inventories, net ....................... 495,137 180,248 — 675,385
Prepaid expenses and other current assets . . ............ 30,528 7,354 — 37,882
Prepaid taxes .................................. 11,012 (5,467) — 5,545
Deferred taxes.................................. 33,152 1,706 — 34,858
Total current assets ............................ 1,204,321 262,740 (26,720) 1,440,341
Property and equipment:
Land . ....................................... 2,670 8,042 — 10,712
Buildings and leasehold improvements ................ 212,286 93,520 — 305,806
Fixtures and equipment ........................... 348,576 77,265 — 425,841
563,532 178,827 — 742,359
Less accumulated depreciation and amortization . . ....... 237,838 48,058 — 285,896
Net property and equipment ...................... 325,694 130,769 — 456,463
Investment ...................................... 517,332 — (517,332) —
Goodwill, net . . .................................. 1,098,089 305,818 — 1,403,907
Deferred financing fees ............................. 14,356 19 — 14,375
Deferred taxes . .................................. (6,329) 12,133 — 5,804
Other noncurrent assets ............................. 9,547 19,147 — 28,694
Total other assets . ............................. 1,632,995 337,117 (517,332) 1,452,780
Total assets .................................. $3,163,010 $730,626 $(544,052) $3,349,584
LIABILITIES AND STOCKHOLDERS’ EQUITY (DEFICIT):
Current liabilities:
Accounts payable . . ............................. $ 569,435 $148,433 $ — $ 717,868
Accrued liabilities . . ............................. 321,944 61,792 (26,720) 357,016
Note payable, current portion ....................... 12,173 — — 12,173
Total current liabilities . . . ....................... 903,552 210,225 (26,720) 1,087,057
Senior notes payable, long-term portion, net . . ............ 593,311 — — 593,311
Senior floating rate notes payable, long-term portion . ....... 250,000 — — 250,000
Deferred rent and other long-term liabilities . . ............ 40,269 3,069 — 43,338
Total long-term liabilities . ....................... 883,580 3,069 — 886,649
Total liabilities . . ............................. 1,787,132 213,294 (26,720) 1,973,706
Stockholders’ equity (deficit):
Preferred stock — authorized 5,000 shares; no shares issued
or outstanding . . . ............................. — 50,306 (50,306) —
Class A common stock — $.001 par value; authorized
300,000 shares; 152,305 shares issued and outstanding . . . 152 16,305 (16,305) 152
Additional paid-in-capital . . . ....................... 1,021,903 360,401 (360,401) 1,021,903
Accumulated other comprehensive income (loss) . . ....... 3,227 (2,738) 2,738 3,227
Retained earnings . . ............................. 350,596 93,058 (93,058) 350,596
Total stockholders’ equity (deficit) ................. 1,375,878 517,332 (517,332) 1,375,878
Total liabilities and stockholders’ equity (deficit) ....... $3,163,010 $730,626 $(544,052) $3,349,584
F-36
GAMESTOP CORP.
NOTES TO CONSOLIDATED FINANCIAL STATEMENTS — (Continued)