GameStop 2007 Annual Report Download - page 52
Download and view the complete annual report
Please find page 52 of the 2007 GameStop annual report below. You can navigate through the pages in the report by either clicking on the pages listed below, or by using the keyword search tool below to find specific information within the annual report.-
 1
1 -
2
-
3
-
4
-
5
-
6
-
7
-
8
-
9
-
10
-
11
-
12
-
13
-
14
-
15
-
16
-
17
-
18
-
19
-
20
-
21
-
22
-
23
-
24
-
25
-
26
-
27
-
28
-
29
-
30
-
31
-
32
-
33
-
34
-
35
-
36
-
37
-
38
-
39
-
40
-
41
-
 42
42 -
 43
43 -
 44
44 -
 45
45 -
 46
46 -
 47
47 -
 48
48 -
 49
49 -
 50
50 -
 51
51 -
 52
52 -
 53
53 -
 54
54 -
 55
55 -
 56
56 -
 57
57 -
 58
58 -
 59
59 -
 60
60 -
 61
61 -
 62
62 -
63
-
64
-
65
-
66
-
67
-
68
-
69
-
70
-
71
-
72
-
73
-
74
-
75
-
76
-
77
-
78
-
79
-
80
-
81
-
82
-
83
-
84
-
85
-
86
-
87
-
88
-
89
-
90
-
91
-
92
-
93
-
94
-
95
-
96
-
97
-
98
-
99
-
100
-
101
-
102
-
103
-
104
-
105
-
106
-
107
-
108
-
109
-
110
-
111
-
112
-
113
-
114
-
115
 |
 |
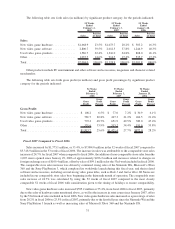
sales led to increases in sales in new video game software, used video game products and accessories and other
products.
The segment operating income in Europe for the 52 weeks ended February 2, 2008 increased to $32.6 million
compared to $1.0 million in the 53 weeks ended February 3, 2007. The increase in the operating income was driven
by the increase in sales and related margin dollars discussed above, the leveraging of selling, general and
administrative expenses, both of which reflect the continued maturation of our operations in the European market,
and the favorable impact of changes in exchange rates since the prior year. For the 52 weeks ended February 2, 2008,
changes in exchange rates when compared to fiscal 2006 had the effect of increasing operating earnings by
$2.7 million.
Fiscal 2006 Compared to Fiscal 2005
Segment results for the 53 weeks ended February 3, 2007 include the first full year of sales and operating
earnings for the 2,350 EB stores acquired in fiscal 2005. Segment results for the 52 weeks ended January 28, 2006
only include the results of operations of the EB stores from October 9, 2005 though January 28, 2006 due to the
mergers and therefore is not comparable. Prior to the mergers, the Company’s international operations only
included Ireland and the United Kingdom which were not material. Having segment results for fiscal 2006 from
Canada, Australia and Europe increased international segment sales and operating earnings as a percentage of total
sales and operating earnings from 12.4% and 9.9%, respectively, in fiscal 2005 to 19.7% and 14.5%, respectively, in
fiscal 2006. Management does not believe that a further comparison of international segment results for fiscal 2006
to fiscal 2005 would be meaningful.
Liquidity and Capital Resources
During fiscal 2007, cash provided by operations was $502.7 million, compared to cash provided by operations
of $423.5 million in fiscal 2006. The increase in cash provided by operations of $79.2 million from fiscal 2006 to
fiscal 2007 resulted from an increase in net income of $130.0 million, as previously discussed, as well as a net
decrease in prepaid taxes and taxes payable of $61.8 million and an increase in depreciation and amortization of
$21.1 million due primarily to new store growth. These increases in cash provided by operations were offset by an
increase in merchandise inventories of $59.1 million primarily due to new store growth; the increase in the excess
tax benefits realized from the exercise of stock-based awards of $49.6 million; an increase in receivables of
$24.6 million due primarily to an increase in sales and store growth and a decrease in accounts payable and accrued
liabilities of $23.6 million due to the timing of payments associated with inventory.
During fiscal 2006, cash provided by operations was $423.5 million, compared to cash provided by operations
of $291.4 million in fiscal 2005. The increase in cash provided by operations of $132.1 million from fiscal 2005 to
fiscal 2006 resulted from an increase in net income of $57.5 million, primarily due to the addition of EB’s results of
operations since the mergers and the 53rd week included in fiscal 2006; an increase in depreciation and amortization
of $43.5 million due primarily to the mergers; an increase in the growth in accounts payable and accrued liabilities,
net of growth in merchandise inventories and the provision for inventory reserves of $47.9 million caused by growth
of the Company and efforts to manage working capital; an increase in the cash provided by prepaid taxes of
$43.6 million offset by the change in the effect of the tax benefit realized from the exercise of stock options of
$56.1 million; and an increase in the non-cash adjustment for stock-based compensation expense due to the
implementation of SFAS 123(R) in fiscal 2006 of $20.6 million, all of which were offset by a net decrease in prepaid
expenses and other current assets of $41.0 million due primarily to the store growth and the timing of rent payments
at the end of the fiscal 2006.
Cash used in investing activities was $174.5 million in fiscal 2007 and $125.9 million during fiscal 2006 and
$996.8 million in fiscal 2005. During fiscal 2007, $175.6 million of capital expenditures were primarily used to
open 586 stores in the United States and internationally and to invest in information systems, which were offset by
$1.1 million of cash received related to the finalization of the purchase price of Game Brands Inc. which was
acquired during the fourth quarter of fiscal 2006. During fiscal 2006, $133.9 million of capital expenditures were
primarily used to invest in information and distribution systems in support of the integration of the operations of EB,
to open new stores in the United States and for international expansion. Also, during the fourth quarter of fiscal
37