GameStop 2007 Annual Report Download - page 37
Download and view the complete annual report
Please find page 37 of the 2007 GameStop annual report below. You can navigate through the pages in the report by either clicking on the pages listed below, or by using the keyword search tool below to find specific information within the annual report.-
 1
1 -
2
-
3
-
4
-
5
-
6
-
7
-
8
-
9
-
10
-
11
-
12
-
13
-
14
-
15
-
16
-
17
-
18
-
19
-
20
-
21
-
22
-
23
-
24
-
25
-
26
-
 27
27 -
 28
28 -
 29
29 -
 30
30 -
 31
31 -
 32
32 -
 33
33 -
 34
34 -
 35
35 -
 36
36 -
 37
37 -
 38
38 -
 39
39 -
 40
40 -
 41
41 -
 42
42 -
 43
43 -
 44
44 -
 45
45 -
 46
46 -
 47
47 -
48
-
49
-
50
-
51
-
52
-
53
-
54
-
55
-
56
-
57
-
58
-
59
-
60
-
61
-
62
-
63
-
64
-
65
-
66
-
67
-
68
-
69
-
70
-
71
-
72
-
73
-
74
-
75
-
76
-
77
-
78
-
79
-
80
-
81
-
82
-
83
-
84
-
85
-
86
-
87
-
88
-
89
-
90
-
91
-
92
-
93
-
94
-
95
-
96
-
97
-
98
-
99
-
100
-
101
-
102
-
103
-
104
-
105
-
106
-
107
-
108
-
109
-
110
-
111
-
112
-
113
-
114
-
115
 |
 |

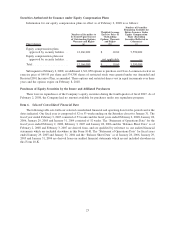
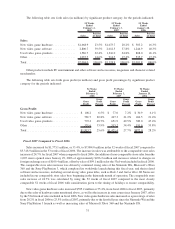
The following table sets forth, for the periods indicated, the high and low sales prices (as adjusted for the Stock
Split) of the Class A common stock on the NYSE Composite Tape:
High Low
Fiscal 2007
Fourth Quarter .................................................. $63.77 $44.76
Third Quarter ................................................... $60.80 $37.40
Second Quarter .................................................. $44.00 $32.31
First Quarter .................................................... $35.85 $24.95
High Low
Fiscal 2006
Fourth Quarter .................................................. $29.21 $24.51
Third Quarter ................................................... $26.37 $20.05
Second Quarter .................................................. $24.26 $17.94
First Quarter .................................................... $24.84 $18.63
The following table sets forth, for the periods indicated, the high and low sales prices of the Class B common
stock on the NYSE Composite Tape:
High Low
Fiscal 2007
First Quarter .................................................... $53.96 $52.25
High Low
Fiscal 2006
Fourth Quarter .................................................. $58.32 $47.73
Third Quarter ................................................... $51.15 $36.25
Second Quarter .................................................. $44.09 $32.58
First Quarter .................................................... $45.68 $33.90
The high and low sales prices of the Class B shares do not include the effects of the February 7, 2007
conversion of all outstanding Class B common shares into Class A common shares on a one-for-one basis (the
“Conversion”) or the Stock Split.
Approximate Number of Holders of Common Equity
As of March 10, 2008, there were approximately 1,254 record holders of the Company’s Class A common
stock, par value $.001 per share.
Dividends
The Company has never declared or paid any dividends on its common stock. We may consider in the future the
advisability of paying dividends. However, our payment of dividends is and will continue to be restricted by or
subject to, among other limitations, applicable provisions of federal and state laws, our earnings and various
business considerations, including our financial condition, results of operations, cash flow, the level of our capital
expenditures, our future business prospects, our status as a holding company and such other matters that our Board
of Directors deems relevant. In addition, the terms of the senior credit facility and the terms of the Indenture
governing the senior notes each restrict our ability to pay dividends. See “Liquidity and Capital Resources”
included in “Management’s Discussion and Analysis of Financial Condition and Results of Operations.”
22