GameStop 2007 Annual Report Download - page 41
Download and view the complete annual report
Please find page 41 of the 2007 GameStop annual report below. You can navigate through the pages in the report by either clicking on the pages listed below, or by using the keyword search tool below to find specific information within the annual report.-
 1
1 -
2
-
3
-
4
-
5
-
6
-
7
-
8
-
9
-
10
-
11
-
12
-
13
-
14
-
15
-
16
-
17
-
18
-
19
-
20
-
21
-
22
-
23
-
24
-
25
-
26
-
27
-
28
-
29
-
30
-
 31
31 -
 32
32 -
 33
33 -
 34
34 -
 35
35 -
 36
36 -
 37
37 -
 38
38 -
 39
39 -
 40
40 -
 41
41 -
 42
42 -
 43
43 -
 44
44 -
 45
45 -
 46
46 -
 47
47 -
 48
48 -
 49
49 -
 50
50 -
 51
51 -
52
-
53
-
54
-
55
-
56
-
57
-
58
-
59
-
60
-
61
-
62
-
63
-
64
-
65
-
66
-
67
-
68
-
69
-
70
-
71
-
72
-
73
-
74
-
75
-
76
-
77
-
78
-
79
-
80
-
81
-
82
-
83
-
84
-
85
-
86
-
87
-
88
-
89
-
90
-
91
-
92
-
93
-
94
-
95
-
96
-
97
-
98
-
99
-
100
-
101
-
102
-
103
-
104
-
105
-
106
-
107
-
108
-
109
-
110
-
111
-
112
-
113
-
114
-
115
 |
 |
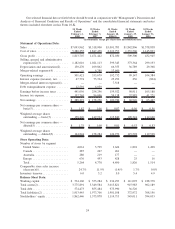
Our fiscal year is composed of 52 or 53 weeks ending on the Saturday closest to January 31. The fiscal years
ended February 2, 2008 (“fiscal 2007”) and January 28, 2006 (“fiscal 2005”) consisted of 52 weeks. The fiscal year
ended February 3, 2007 (“fiscal 2006”) consisted of 53 weeks.
On October 8, 2005, GameStop Holdings Corp. (“Historical GameStop”), formerly known as GameStop
Corp., and Electronics Boutique Holdings Corp. (“EB” or “Electronics Boutique”) completed their previously
announced mergers pursuant to the Agreement and Plan of Merger, dated as of April 17, 2005 (the “Merger
Agreement”). Upon the consummation of the mergers, Historical GameStop and EB became wholly-owned
subsidiaries of the Company, a Delaware corporation formed for the purpose of consummating the business
combination (the “mergers”). The mergers of Historical GameStop and EB have been treated as a purchase business
combination for accounting purposes, with Historical GameStop designated as the acquirer. Therefore, the
historical financial statements of Historical GameStop became the historical financial statements of the Company.
The accompanying consolidated financial statements and notes thereto include the results of operations of EB from
October 9, 2005 forward. Therefore, the Company’s operating results for the fiscal year ended January 28, 2006
include 16 weeks of EB’s results and 52 weeks, respectively, of Historical GameStop’s results. The Company’s
operating results for the fiscal years ended February 2, 2008 and February 3, 2007 include 52 weeks and 53 weeks,
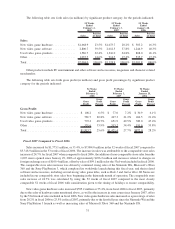
respectively, for both Historical GameStop and EB. As a result, sales mix, cost of sales, gross profit, selling, general
and administrative expenses, depreciation and amortization and interest expense in fiscal 2006 were significantly
impacted by including the operations of EB for a full year, as opposed to 16 weeks in fiscal 2005, which included the
holiday selling season. Growth in each of these statement of operations line items came from each of the Company’s
business segments.
Under the terms of the Merger Agreement, Historical GameStop’s stockholders received one share of the
Company’s common stock for each share of Historical GameStop’s common stock owned. Approximately
104.2 million shares of the Company’s common stock were issued in exchange for all outstanding common stock
of Historical GameStop based on the one-for-one ratio. EB stockholders received $19.08 in cash and .39398 of a
share of the Company’s common stock for each share of EB common stock owned. In aggregate, 40.5 million shares
of the Company’s common stock were issued to EB stockholders at a value of approximately $437.1 million (based
on the closing price of $10.81 of Historical GameStop’s common stock on April 15, 2005, the last trading day before
the date the mergers were announced). In addition, approximately $993.3 million in cash was paid in consideration
for (i) all outstanding common stock of EB, based upon the pro-ration provisions of the Merger Agreement, and
(ii) all outstanding stock options of EB. Including transaction costs of $13.6 million, the total consideration paid
was approximately $1.4 billion.
On February 7, 2007, following approval by a majority of the Class B common stockholders in a special
meeting of the Company’s Class B common stockholders, all outstanding Class B common shares were converted
into Class A common shares on a one-for-one basis. In addition, on February 9, 2007, the Board of Directors of the
Company authorized a two-for-one stock split, effected by a one-for-one stock dividend to stockholders of record at
the close of business on February 20, 2007, paid on March 16, 2007 (the “Stock Split”). Unless otherwise indicated,
all numbers in this “Management’s Discussion and Analysis of Financial Condition and Results of Operations”
have been restated to reflect the conversion and the Stock Split.
Growth in the video game industry is driven by the introduction of new technology. In March of fiscal 2005 in
the North American markets and September of fiscal 2005 in the Australian and European markets, Sony introduced
the PlayStation Portable (the “PSP”) and Microsoft introduced the Xbox 360 in November of fiscal 2005 in North
America and Europe and the first quarter of fiscal 2006 in Australia. In November 2006, Nintendo introduced the
Wii hardware platform worldwide and Sony introduced the PlayStation 3 hardware platform in the North American
markets. Sony introduced the PlayStation 3 platform in the Australian and European markets in March 2007.
Typically, in the first full year following the introduction of new video game platforms, sales of new video game
hardware increase as a percentage of sales. As video game platforms mature, the sales mix attributable to
complementary video game software and accessories, which generate higher gross margins, generally increases in
the second and third years. The net effect is generally a decline in gross margins in the first full year following new
platform releases and an increase in gross margins in the second and third years. Unit sales of maturing video game
platforms are typically also driven by manufacturer-funded retail price decreases, further driving sales of related
software and accessories. We expect that the installed base of the hardware platforms listed above and sales of
26