GameStop 2007 Annual Report Download - page 45
Download and view the complete annual report
Please find page 45 of the 2007 GameStop annual report below. You can navigate through the pages in the report by either clicking on the pages listed below, or by using the keyword search tool below to find specific information within the annual report.-
 1
1 -
2
-
3
-
4
-
5
-
6
-
7
-
8
-
9
-
10
-
11
-
12
-
13
-
14
-
15
-
16
-
17
-
18
-
19
-
20
-
21
-
22
-
23
-
24
-
25
-
26
-
27
-
28
-
29
-
30
-
31
-
32
-
33
-
34
-
 35
35 -
 36
36 -
 37
37 -
 38
38 -
 39
39 -
 40
40 -
 41
41 -
 42
42 -
 43
43 -
 44
44 -
 45
45 -
 46
46 -
 47
47 -
 48
48 -
 49
49 -
 50
50 -
 51
51 -
 52
52 -
 53
53 -
 54
54 -
 55
55 -
56
-
57
-
58
-
59
-
60
-
61
-
62
-
63
-
64
-
65
-
66
-
67
-
68
-
69
-
70
-
71
-
72
-
73
-
74
-
75
-
76
-
77
-
78
-
79
-
80
-
81
-
82
-
83
-
84
-
85
-
86
-
87
-
88
-
89
-
90
-
91
-
92
-
93
-
94
-
95
-
96
-
97
-
98
-
99
-
100
-
101
-
102
-
103
-
104
-
105
-
106
-
107
-
108
-
109
-
110
-
111
-
112
-
113
-
114
-
115
 |
 |

In July 2006, the FASB issued Interpretation No. 48, Accounting for Uncertainty in Income Taxes
(“FIN 48”), which clarifies the accounting for uncertainty in income taxes recognized under SFAS 109. FIN 48
addresses the recognition and measurement of tax positions taken or expected to be taken, and also provides
guidance on derecognition, classification, interest and penalties, accounting in interim periods and disclosure.
The Company adopted and applied FIN 48 under the transition provisions to all of its income tax positions at
the required effective date of February 4, 2007, resulting in a $16.7 million cumulative effect decrease to
retained earnings and a $7.9 million increase in prepaid taxes. For additional information related to the
Company’s adoption of FIN 48, see Note 12 of “Notes to Consolidated Financial Statements.”
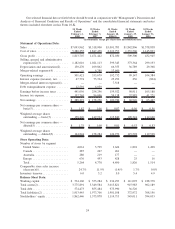
Consolidated Results of Operations
The following table sets forth certain income statement items as a percentage of sales for the periods indicated:
52 Weeks Ended
February 2,
2008
53 Weeks Ended
February 3,
2007
52 Weeks Ended
January 28,
2006
Statement of Operations Data:
Sales ................................. 100.0% 100.0% 100.0%
Cost of sales ........................... 74.4 72.3 71.8
Gross profit ............................ 25.6 27.7 28.2
Selling, general and administrative expenses .... 16.7 19.2 19.4
Depreciation and amortization............... 1.8 2.1 2.2
Merger-related expenses ................... — 0.1 0.4
Operating earnings ....................... 7.1 6.3 6.2
Interest expense, net ...................... 0.7 1.4 0.8
Merger-related interest expense .............. — — 0.2
Debt extinguishment expense ............... 0.2 0.1 —
Earnings before income taxes ............... 6.2 4.8 5.2
Income tax expense ...................... 2.1 1.8 1.9
Net earnings............................ 4.1% 3.0% 3.3%
The Company includes purchasing, receiving and distribution costs in selling, general and administrative
expenses, rather than cost of goods sold, in the statement of operations. For the fiscal years ended February 2, 2008,
February 3, 2007 and January 28, 2006, these purchasing, receiving and distribution costs amounted to $43.9 mil-
lion, $35.9 million and $20.8 million, respectively. The Company includes processing fees associated with
purchases made by check and credit cards in cost of sales, rather than selling, general and administrative expenses,
in the statement of operations. For the fiscal years ended February 2, 2008, February 3, 2007 and January 28, 2006,
these processing fees amounted to $55.2 million, $40.9 million and $20.9 million, respectively. As a result of these
classifications, our gross margins are not comparable to those retailers that include purchasing, receiving and
distribution costs in cost of sales and include processing fees associated with purchases made by check and credit
cards in selling, general and administrative expenses. The net effect of the Company’s classifications is that its cost
of sales as a percentage of sales is higher than, and its selling, general and administrative expenses as a percentage of
sales are lower than, they would have been had the Company’s treatment conformed with those retailers that include
purchasing, receiving and distribution costs in cost of sales and include processing fees associated with purchases
made by check and credit cards in selling, general and administrative expenses, by 0.2%, 0.1% and 0.0% for the
fiscal years ended February 2, 2008, February 3, 2007 and January 28, 2006, respectively.
30