GameStop 2007 Annual Report Download - page 47
Download and view the complete annual report
Please find page 47 of the 2007 GameStop annual report below. You can navigate through the pages in the report by either clicking on the pages listed below, or by using the keyword search tool below to find specific information within the annual report.-
 1
1 -
2
-
3
-
4
-
5
-
6
-
7
-
8
-
9
-
10
-
11
-
12
-
13
-
14
-
15
-
16
-
17
-
18
-
19
-
20
-
21
-
22
-
23
-
24
-
25
-
26
-
27
-
28
-
29
-
30
-
31
-
32
-
33
-
34
-
35
-
36
-
 37
37 -
 38
38 -
 39
39 -
 40
40 -
 41
41 -
 42
42 -
 43
43 -
 44
44 -
 45
45 -
 46
46 -
 47
47 -
 48
48 -
 49
49 -
 50
50 -
 51
51 -
 52
52 -
 53
53 -
 54
54 -
 55
55 -
 56
56 -
 57
57 -
58
-
59
-
60
-
61
-
62
-
63
-
64
-
65
-
66
-
67
-
68
-
69
-
70
-
71
-
72
-
73
-
74
-
75
-
76
-
77
-
78
-
79
-
80
-
81
-
82
-
83
-
84
-
85
-
86
-
87
-
88
-
89
-
90
-
91
-
92
-
93
-
94
-
95
-
96
-
97
-
98
-
99
-
100
-
101
-
102
-
103
-
104
-
105
-
106
-
107
-
108
-
109
-
110
-
111
-
112
-
113
-
114
-
115
 |
 |
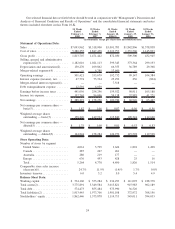
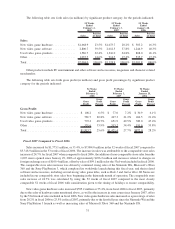
New video game software sales increased $788.2 million, or 39.2%, from fiscal 2006 to fiscal 2007, primarily
due to new stores added in fiscal 2007, sales related to the new hardware platforms and a strong lineup of new video
game titles released during the 52 weeks ended February 2, 2008. New video game software sales as a percentage of
total sales increased from 37.8% in fiscal 2006 to 39.5% in fiscal 2007 due to increased sales related to the new
hardware platforms and the availability of several strong titles in fiscal 2007.
Used video game product sales increased $270.7 million, or 20.6%, from fiscal 2006 to fiscal 2007, primarily
due to the increase in new store count, an increase in overall demand for video game products following the launch
of new hardware platforms and the strong growth of used video game product sales internationally, offset by the
53rd week of sales in fiscal 2006. As a percentage of sales, used video game product sales decreased from 24.8% to
22.4% primarily due to the strong sales of new video game hardware and software. Sales of other product
categories, including PC entertainment and other software and accessories, magazines and trading cards, grew
13.2%, or $121.0 million, from fiscal 2006 to fiscal 2007, primarily due to the increase in store count and the
increase in new hardware platform accessories sales, offset by the 53rd week of sales in fiscal 2006.
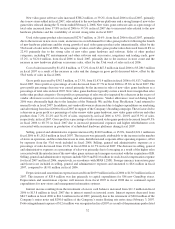
Cost of sales increased by $1,432.8 million, or 37.2%, from $3,847.5 million in fiscal 2006 to $5,280.3 million
in fiscal 2007 as a result of the increase in sales and the changes in gross profit discussed below, offset by the
53rd week of sales in fiscal 2006.
Gross profit increased by $342.3 million, or 23.3%, from $1,471.4 million in fiscal 2006 to $1,813.7 million in
fiscal 2007. Gross profit as a percentage of sales decreased from 27.7% in fiscal 2006 to 25.6% in fiscal 2007. The
gross profit percentage decrease was caused primarily by the increase in sales of new video game hardware as a
percentage of total sales in fiscal 2007. New video game hardware typically carries a much lower margin than sales
in the other product categories. Gross profit as a percentage of sales was also impacted by a decrease in the excess of
vendor allowances received over marketing and advertising expenses. Vendor allowances received during fiscal
2006 were abnormally high due to the launches of the Nintendo Wii and the Sony PlayStation 3 and returned to
normal levels in fiscal 2007. In addition, net vendor allowances decreased due to higher expenditures on marketing
and advertising from fiscal 2006 to fiscal 2007 in support of the Company’s branding campaign. These factors led to
a decrease in gross profit as a percentage of sales on new video game hardware, new video game software and other
products from 7.2%, 21.2% and 34.4% of sales, respectively, in fiscal 2006 to 6.5%, 20.8% and 33.9% of sales,
respectively, in fiscal 2007. Gross profit as a percentage of sales on used video game products decreased from 49.5%
in fiscal 2006 to 48.7% in fiscal 2007 due to increased promotional expenses and higher refurbishment costs
associated with an increase in production of refurbished hardware platforms during fiscal 2007.
Selling, general and administrative expenses increased by $160.9 million, or 15.8%, from $1,021.1 million in
fiscal 2006 to $1,182.0 million in fiscal 2007. The increase was primarily attributable to the increase in the number
of stores in operation, and the related increases in store, distribution and corporate office operating expenses, offset
by expenses from the 53rd week included in fiscal 2006. Selling, general and administrative expenses as a
percentage of sales decreased from 19.2% in fiscal 2006 to 16.7% in fiscal 2007. The decrease in selling, general
and administrative expenses as a percentage of sales was primarily due to leveraging as a result of the higher sales
associated with the introduction of the new video game systems and synergies associated with the acquisition of EB.
Selling, general and administrative expenses include $26.9 and $21.0 million in stock-based compensation expense
for fiscal 2007 and fiscal 2006, respectively, in accordance with SFAS 123(R). Foreign currency transaction gains
and (losses) are included in selling, general and administrative expenses and amounted to $8.6 million in fiscal
2007, compared to ($1.0) million in fiscal 2006.
Depreciation and amortization expense increased from $109.9 million in fiscal 2006 to $130.3 million in fiscal
2007. This increase of $20.4 million was due primarily to capital expenditures for 586 new GameStop stores.
Depreciation and amortization expense will increase from fiscal 2007 to fiscal 2008 due to continued capital
expenditures for new stores and management information systems.
Interest income resulting from the investment of excess cash balances increased from $11.3 million in fiscal
2006 to $13.8 million in fiscal 2007 due to interest earned on invested assets. Interest expense decreased from
$84.7 million in fiscal 2006 to $61.6 million in fiscal 2007, primarily due to the retirement of $20.0 million of the
Company’s senior notes and $250.0 million of the Company’s senior floating rate notes since February 3, 2007.
Debt extinguishment expense of $12.6 million was recognized in fiscal 2007 as a result of the premiums paid related
32