GameStop 2007 Annual Report Download - page 46
Download and view the complete annual report
Please find page 46 of the 2007 GameStop annual report below. You can navigate through the pages in the report by either clicking on the pages listed below, or by using the keyword search tool below to find specific information within the annual report.-
 1
1 -
2
-
3
-
4
-
5
-
6
-
7
-
8
-
9
-
10
-
11
-
12
-
13
-
14
-
15
-
16
-
17
-
18
-
19
-
20
-
21
-
22
-
23
-
24
-
25
-
26
-
27
-
28
-
29
-
30
-
31
-
32
-
33
-
34
-
35
-
 36
36 -
 37
37 -
 38
38 -
 39
39 -
 40
40 -
 41
41 -
 42
42 -
 43
43 -
 44
44 -
 45
45 -
 46
46 -
 47
47 -
 48
48 -
 49
49 -
 50
50 -
 51
51 -
 52
52 -
 53
53 -
 54
54 -
 55
55 -
 56
56 -
57
-
58
-
59
-
60
-
61
-
62
-
63
-
64
-
65
-
66
-
67
-
68
-
69
-
70
-
71
-
72
-
73
-
74
-
75
-
76
-
77
-
78
-
79
-
80
-
81
-
82
-
83
-
84
-
85
-
86
-
87
-
88
-
89
-
90
-
91
-
92
-
93
-
94
-
95
-
96
-
97
-
98
-
99
-
100
-
101
-
102
-
103
-
104
-
105
-
106
-
107
-
108
-
109
-
110
-
111
-
112
-
113
-
114
-
115
 |
 |

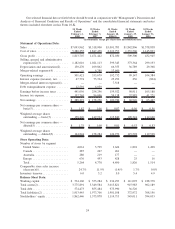
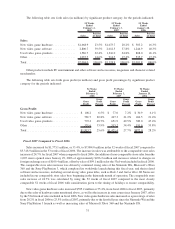
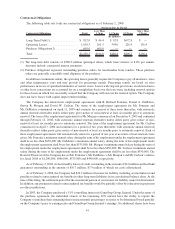
The following table sets forth sales (in millions) by significant product category for the periods indicated:
Sales
Percent
of Total Sales
Percent
of Total Sales
Percent
of Total
52 Weeks
Ended
February 2,
2008
53 Weeks
Ended
February 3,
2007
52 Weeks
Ended
January 28,
2006
Sales:
New video game hardware .............. $1,668.9 23.5% $1,073.7 20.2% $ 503.2 16.3%
New video game software .............. 2,800.7 39.5% 2,012.5 37.8% 1,244.9 40.3%
Used video game products .............. 1,586.7 22.4% 1,316.0 24.8% 808.0 26.1%
Other .............................. 1,037.7 14.6% 916.7 17.2% 535.7 17.3%
Total .............................. $7,094.0 100.0% $5,318.9 100.0% $3,091.8 100.0%
Other products include PC entertainment and other software and accessories, magazines and character-related
merchandise.
The following table sets forth gross profit (in millions) and gross profit percentages by significant product
category for the periods indicated:
Gross
Profit
Gross
Profit
Percent
Gross
Profit
Gross
Profit
Percent
Gross
Profit
Gross
Profit
Percent
52 Weeks
Ended
February 2,
2008
53 Weeks
Ended
February 3,
2007
52 Weeks
Ended
January 28,
2006
Gross Profit:
New video game hardware ............... $ 108.2 6.5% $ 77.0 7.2% $ 30.9 6.1%
New video game software ................ 581.7 20.8% 427.3 21.2% 266.5 21.4%
Used video game products ................ 772.2 48.7% 651.9 49.5% 383.0 47.4%
Other ............................... 351.6 33.9% 315.2 34.4% 191.6 35.8%
Total ................................ $1,813.7 25.6% $1,471.4 27.7% $872.0 28.2%
Fiscal 2007 Compared to Fiscal 2006
Sales increased by $1,775.1 million, or 33.4%, to $7,094.0 million in the 52 weeks of fiscal 2007 compared to
$5,318.9 million in the 53 weeks of fiscal 2006. The increase in sales was attributable to the comparable store sales
increase of 24.7% for fiscal 2007 when compared to fiscal 2006, the addition of non-comparable store sales from the
1,007 stores opened since January 29, 2006 of approximately $496.2 million and increases related to changes in
foreign exchange rates of $109.4 million, offset by sales of $99.1 million for the 53rd week included in fiscal 2006.
The comparable store sales increase was driven by continued strong sales of the Nintendo Wii, Microsoft’s Xbox
360 and the Sony PlayStation 3, which completed its worldwide launch during this fiscal year, and their related
software and accessories, including several strong video game titles, such as Halo 3 and Guitar Hero III. Stores are
included in our comparable store sales base beginning in the thirteenth month of operation. The comparable store
sales increase of 24.7% was calculated by using the 52 weeks of fiscal 2007 compared to the most closely
comparable 52 weeks of fiscal 2006 with consideration given to the timing of holidays to ensure comparability.
New video game hardware sales increased $595.2 million or 55.4%, from fiscal 2006 to fiscal 2007, primarily
due to the sales of hardware units mentioned above, as well as the increase in store count since January 2007, offset
by the 53rd week of sales included in fiscal 2006. New video game hardware sales increased as a percentage of sales
from 20.2% in fiscal 2006 to 23.5% in fiscal 2007, primarily due to the first full year since the Nintendo Wii and the
Sony PlayStation 3 launch as well as increasing sales of Microsoft Xbox 360 and the Nintendo DS.
31