GameStop 2007 Annual Report Download - page 49
Download and view the complete annual report
Please find page 49 of the 2007 GameStop annual report below. You can navigate through the pages in the report by either clicking on the pages listed below, or by using the keyword search tool below to find specific information within the annual report.-
 1
1 -
2
-
3
-
4
-
5
-
6
-
7
-
8
-
9
-
10
-
11
-
12
-
13
-
14
-
15
-
16
-
17
-
18
-
19
-
20
-
21
-
22
-
23
-
24
-
25
-
26
-
27
-
28
-
29
-
30
-
31
-
32
-
33
-
34
-
35
-
36
-
37
-
38
-
 39
39 -
 40
40 -
 41
41 -
 42
42 -
 43
43 -
 44
44 -
 45
45 -
 46
46 -
 47
47 -
 48
48 -
 49
49 -
 50
50 -
 51
51 -
 52
52 -
 53
53 -
 54
54 -
 55
55 -
 56
56 -
 57
57 -
 58
58 -
 59
59 -
60
-
61
-
62
-
63
-
64
-
65
-
66
-
67
-
68
-
69
-
70
-
71
-
72
-
73
-
74
-
75
-
76
-
77
-
78
-
79
-
80
-
81
-
82
-
83
-
84
-
85
-
86
-
87
-
88
-
89
-
90
-
91
-
92
-
93
-
94
-
95
-
96
-
97
-
98
-
99
-
100
-
101
-
102
-
103
-
104
-
105
-
106
-
107
-
108
-
109
-
110
-
111
-
112
-
113
-
114
-
115
 |
 |
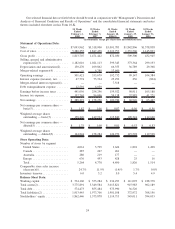
efforts to monitor margin rates and the application of GameStop’s merchandising algorithms to EB’s used video
game category for all of fiscal 2006 compared to only the period following the mergers in fiscal 2005.
Selling, general and administrative expenses increased by $421.8 million, or 70.4%, from $599.3 million in
fiscal 2005 to $1,021.1 million in fiscal 2006. The increase was primarily attributable to the mergers, the increase in
the number of stores in operation, and the related increases in store, distribution and corporate office operating
expenses as well as expenses from the 53rd week included in fiscal 2006. Selling, general and administrative
expenses as a percentage of sales decreased from 19.4% in fiscal 2005 to 19.2% in fiscal 2006. The decrease in
selling, general and administrative expenses as a percentage of sales was primarily due to synergies obtained from
the mergers, including the shut-down of EB’s corporate headquarters and distribution center. Foreign currency
transaction gains and (losses) are included in selling, general and administrative expenses and amounted to
($1.0) million in fiscal 2006, compared to $2.6 million in fiscal 2005. These amounts were offset by the changes
related to the adoption of SFAS 123(R) discussed below.
Beginning January 29, 2006, the Company adopted the provisions of SFAS 123(R) using the modified
prospective application method. Under this method, the Company records stock-based compensation expense based
on the estimated grant-date fair value previously presented in the pro forma footnote disclosures for all options
granted prior to, but not vested as of, the adoption date. In addition, the Company records compensation expense for
the share-based awards granted after the adoption date in accordance with SFAS 123(R). As a result of the adoption,
the Company recognized $21.0 million of stock-based compensation expense in selling, general and administrative
expenses for fiscal 2006. In accordance with SFAS 123(R), prior periods have not been restated.
Depreciation and amortization expense increased from $66.4 million in fiscal 2005 to $109.9 million in fiscal
2006. This increase of $43.5 million was due primarily to the mergers, with the remaining increase due to capital
expenditures for 421 new GameStop stores and the Company’s new corporate headquarters and distribution facility.
The Company’s results of operations for fiscal 2006 and fiscal 2005 include expenses believed to be of a one-
time or short-term nature associated with the mergers, which included $6.8 million and $13.6 million, respectively,
considered in operating earnings and $7.5 million included in fiscal 2005 in interest expense. The $6.8 million and
$13.6 million included $1.9 million and $9.0 million, respectively, in charges associated with assets of the Company
considered to be impaired as a result of the mergers and $4.9 million and $4.6 million, respectively, in costs
associated with integrating the operations of Historical GameStop and EB. Costs related to the mergers included in
interest expense in fiscal 2005 include a fee of $7.1 million for an unused bridge financing facility which the
Company obtained as financing insurance in connection with the mergers.
Interest income resulting from the investment of excess cash balances increased from $5.1 million in fiscal
2005 to $11.3 million in fiscal 2006 due to interest earned on invested assets. Interest expense increased from
$30.4 million in fiscal 2005 to $84.7 million in fiscal 2006 primarily due to the first full year of interest incurred on
the senior notes payable and the senior floating rate notes payable and the interest incurred on the note payable to
Barnes & Noble in connection with the repurchase of Historical GameStop’s Class B common stock in fiscal 2004.
Debt extinguishment expense of $6.1 million was incurred in fiscal 2006 for the loss associated with the Company’s
repurchase of $50.0 million of its senior notes payable and $50.0 million of its senior floating rate notes payable.
Income tax expense increased by $36.9 million, from $59.1 million in fiscal 2005 to $96.0 million in fiscal
2006. The Company’s effective tax rate increased from 37.0% in fiscal 2005 to 37.8% in fiscal 2006 due to
corporate restructuring. See Note 12 of “Notes to Consolidated Financial Statements” for additional information
regarding income taxes.
The factors described above led to an increase in operating earnings of $141.0 million, or 73.2%, from
$192.7 million in fiscal 2005 to $333.7 million in fiscal 2006 and an increase in net earnings of $57.5 million, or
57.0%, from $100.8 million in fiscal 2005 to $158.3 million in fiscal 2006.
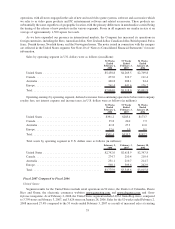
Segment Information
The Company operates its business in the following segments: United States, Canada, Australia and Europe.
We identified these segments based on a combination of geographic areas, the methods with which we analyze
performance and the division of management responsibility. Each of the segments consists primarily of retail
34