GameStop 2007 Annual Report Download - page 22
Download and view the complete annual report
Please find page 22 of the 2007 GameStop annual report below. You can navigate through the pages in the report by either clicking on the pages listed below, or by using the keyword search tool below to find specific information within the annual report.-
 1
1 -
2
-
3
-
4
-
5
-
6
-
7
-
8
-
9
-
10
-
11
-
 12
12 -
 13
13 -
 14
14 -
 15
15 -
 16
16 -
 17
17 -
 18
18 -
 19
19 -
 20
20 -
 21
21 -
 22
22 -
 23
23 -
 24
24 -
 25
25 -
 26
26 -
 27
27 -
 28
28 -
 29
29 -
 30
30 -
 31
31 -
 32
32 -
33
-
34
-
35
-
36
-
37
-
38
-
39
-
40
-
41
-
42
-
43
-
44
-
45
-
46
-
47
-
48
-
49
-
50
-
51
-
52
-
53
-
54
-
55
-
56
-
57
-
58
-
59
-
60
-
61
-
62
-
63
-
64
-
65
-
66
-
67
-
68
-
69
-
70
-
71
-
72
-
73
-
74
-
75
-
76
-
77
-
78
-
79
-
80
-
81
-
82
-
83
-
84
-
85
-
86
-
87
-
88
-
89
-
90
-
91
-
92
-
93
-
94
-
95
-
96
-
97
-
98
-
99
-
100
-
101
-
102
-
103
-
104
-
105
-
106
-
107
-
108
-
109
-
110
-
111
-
112
-
113
-
114
-
115
 |
 |

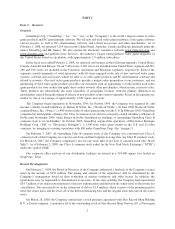
worldwide launch in November 2006, the launch of the Sony PlayStation 3 in Australia and Europe in March
2007 and the release of several strong software titles in the fall of 2007, including Halo 3 by Microsoft,
Guitar Hero III and Call of Duty 4 by Activision, Inc. and Rock Band by Electronic Arts, Inc. In addition,
Microsoft Xbox 360 and Nintendo DS hardware, software and accessories continued their strong sales trend.
During fiscal 2006, despite facing limited supplies of the newly launched Sony PlayStation 3 and Nintendo
Wii, we capitalized on the demand for these new video game systems and the related video game software
and accessories that followed these launches. Over the next few years, we expect to continue to capitalize on
the increasing installed base for these latest generation platforms and the related growth in video game
software and accessories sales.
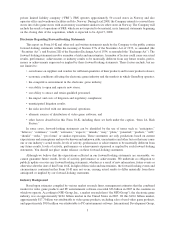
•Increase Sales of Used Video Game Products. We will continue to expand the selection and availability of
used video game products in our stores. Our strategy consists of increasing consumer awareness of the
benefits of trading in and buying used video game products at our stores through increased marketing
activities. We expect the continued growth of new platform technology to drive trade-ins of previous
generation products, as well as next generation platforms, thereby expanding the supply of used video game
products.
•Increase GameStop Brand Awareness. We intend to increase customer awareness of the GameStop brand.
In connection with our brand-building efforts, in each of the last three fiscal years, we increased the amount
of media advertising in targeted markets. In fiscal 2008, we plan to continue to increase media advertising to
increase brand awareness over a broader demographic area, to expand our GameStop loyalty card program,
to aggressively promote trade-ins of used video game products in our stores and to leverage our websites at
www.gamestop.com and www.ebgames.com.
Operating Segments
We identified our four operating segments based on a combination of geographic areas, the methods with
which we analyze performance and the division of management responsibility. Segment results for the United States
include retail operations in the 50 states, the District of Columbia, Guam and Puerto Rico, the electronic commerce
websites www.gamestop.com and www.ebgames.com and Game Informer magazine. Segment results for Canada
include retail operations in stores throughout Canada and segment results for Australia include retail operations in
Australia and New Zealand. Segment results for Europe include retail operations in 12 European countries.
Our U.S. segment is supported by distribution centers in Texas and Kentucky, and further supported through
the use of third-party distribution centers for new release titles. We distribute merchandise to our Canadian segment
from a distribution center in Ontario. We have a distribution center near Brisbane, Australia which supports our
Australian operations and a small distribution facility in New Zealand which supports the stores in New Zealand.
European segment operations are supported by five regionally-located distribution centers.
Our international segments purchase products from many of the same vendors as the U.S., including Sony and
Electronic Arts. Products from certain other vendors such as Microsoft and Nintendo are obtained through
distributors operating in the various countries in which we operate.
Additional information, including financial information, regarding our operating segments can be found in
“Management’s Discussion and Analysis of Financial Condition and Results of Operations” elsewhere in this
Annual Report on Form 10-K and in Note 17 of “Notes to Consolidated Financial Statements.”
Merchandise
Substantially all of our revenues are derived from the sale of tangible products. Our product offerings consist of
new and used video game products, PC entertainment software, and related products, such as trading cards and
strategy guides. Our in-store inventory generally consists of a constantly changing selection of over 4,500 SKUs.
We have buying groups in the U.S., Canada, Australia and Europe that negotiate terms, discounts and cooperative
advertising allowances for the stores in their respective geographic areas. We use customer requests and feedback,
advance orders, industry magazines and product reviews to determine which new releases are expected to be hits.
Advance orders are tracked at individual stores to distribute titles and capture demand effectively. This merchandise
7