GameStop 2007 Annual Report Download - page 50
Download and view the complete annual report
Please find page 50 of the 2007 GameStop annual report below. You can navigate through the pages in the report by either clicking on the pages listed below, or by using the keyword search tool below to find specific information within the annual report.-
 1
1 -
2
-
3
-
4
-
5
-
6
-
7
-
8
-
9
-
10
-
11
-
12
-
13
-
14
-
15
-
16
-
17
-
18
-
19
-
20
-
21
-
22
-
23
-
24
-
25
-
26
-
27
-
28
-
29
-
30
-
31
-
32
-
33
-
34
-
35
-
36
-
37
-
38
-
39
-
 40
40 -
 41
41 -
 42
42 -
 43
43 -
 44
44 -
 45
45 -
 46
46 -
 47
47 -
 48
48 -
 49
49 -
 50
50 -
 51
51 -
 52
52 -
 53
53 -
 54
54 -
 55
55 -
 56
56 -
 57
57 -
 58
58 -
 59
59 -
 60
60 -
61
-
62
-
63
-
64
-
65
-
66
-
67
-
68
-
69
-
70
-
71
-
72
-
73
-
74
-
75
-
76
-
77
-
78
-
79
-
80
-
81
-
82
-
83
-
84
-
85
-
86
-
87
-
88
-
89
-
90
-
91
-
92
-
93
-
94
-
95
-
96
-
97
-
98
-
99
-
100
-
101
-
102
-
103
-
104
-
105
-
106
-
107
-
108
-
109
-
110
-
111
-
112
-
113
-
114
-
115
 |
 |

operations, with all stores engaged in the sale of new and used video game systems, software and accessories which
we refer to as video game products and PC entertainment software and related accessories. These products are
substantially the same regardless of geographic location, with the primary differences in merchandise carried being
the timing of the release of new products in the various segments. Stores in all segments are similar in size at an
average of approximately 1,500 square feet each.
As we have expanded our presence in international markets, the Company has increased its operations in
foreign currencies, including the Euro, Australian dollar, New Zealand dollar, Canadian dollar, British pound, Swiss
franc, Danish kroner, Swedish krona, and the Norwegian kroner. The notes issued in connection with the mergers
are reflected in the United States segment. See Note 20 of “Notes to Consolidated Financial Statements” for more
information.
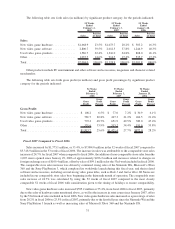
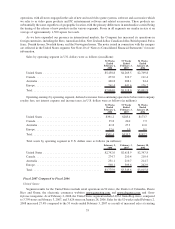
Sales by operating segment in U.S. dollars were as follows (in millions):
52 Weeks
Ended
February 2,
2008
53 Weeks
Ended
February 3,
2007
52 Weeks
Ended
January 28,
2006
United States .................................... $5,438.8 $4,269.5 $2,709.8
Canada......................................... 473.0 319.7 111.4
Australia ....................................... 420.8 288.1 94.4
Europe ......................................... 761.4 441.6 176.2
Total .......................................... $7,094.0 $5,318.9 $3,091.8
Operating earnings by operating segment, defined as income from continuing operations before intercompany
royalty fees, net interest expense and income taxes, in U.S. dollars were as follows (in millions):
52 Weeks
Ended
February 2,
2008
53 Weeks
Ended
February 3,
2007
52 Weeks
Ended
January 28,
2006
United States .................................... $391.2 $285.4 $173.7
Canada......................................... 35.8 20.0 7.9
Australia ....................................... 41.8 27.3 11.0
Europe ......................................... 32.6 1.0 0.1
Total .......................................... $501.4 $333.7 $192.7
Total assets by operating segment in U.S. dollars were as follows (in millions):
February 2,
2008
February 3,
2007
January 28,
2006
United States .................................... $2,742.0 $2,618.9 $2,347.8
Canada......................................... 274.7 210.4 210.4
Australia ....................................... 251.1 210.7 214.7
Europe ......................................... 508.1 309.6 242.9
Total .......................................... $3,775.9 $3,349.6 $3,015.8
Fiscal 2007 Compared to Fiscal 2006
United States
Segment results for the United States include retail operations in 50 states, the District of Columbia, Puerto
Rico and Guam, the electronic commerce websites www.gamestop.com and www.ebgames.com and Game
Informer magazine. As of February 2, 2008, the United States segment included 4,061 GameStop stores, compared
to 3,799 stores on February 3, 2007, and 3,624 stores on January 28, 2006. Sales for the 52 weeks ended February 2,
2008 increased 27.4% compared to the 53 weeks ended February 3, 2007 as a result of increased sales at existing
35