GameStop 2007 Annual Report Download - page 2
Download and view the complete annual report
Please find page 2 of the 2007 GameStop annual report below. You can navigate through the pages in the report by either clicking on the pages listed below, or by using the keyword search tool below to find specific information within the annual report.-
 1
1 -
 2
2 -
 3
3 -
 4
4 -
 5
5 -
 6
6 -
 7
7 -
 8
8 -
 9
9 -
 10
10 -
 11
11 -
 12
12 -
 13
13 -
14
-
15
-
16
-
17
-
18
-
19
-
20
-
21
-
22
-
23
-
24
-
25
-
26
-
27
-
28
-
29
-
30
-
31
-
32
-
33
-
34
-
35
-
36
-
37
-
38
-
39
-
40
-
41
-
42
-
43
-
44
-
45
-
46
-
47
-
48
-
49
-
50
-
51
-
52
-
53
-
54
-
55
-
56
-
57
-
58
-
59
-
60
-
61
-
62
-
63
-
64
-
65
-
66
-
67
-
68
-
69
-
70
-
71
-
72
-
73
-
74
-
75
-
76
-
77
-
78
-
79
-
80
-
81
-
82
-
83
-
84
-
85
-
86
-
87
-
88
-
89
-
90
-
91
-
92
-
93
-
94
-
95
-
96
-
97
-
98
-
99
-
100
-
101
-
102
-
103
-
104
-
105
-
106
-
107
-
108
-
109
-
110
-
111
-
112
-
113
-
114
-
115
 |
 |
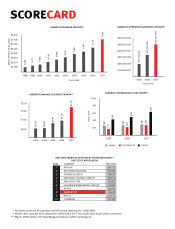
scorecard
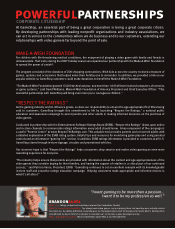
GAMESTOP INTERNATIONAL STORE GROWTH
STORE COUNT
1,000
200
400
600
800
261
177
428
2005
267
219
493
2006
287
280
636
2007
CANADA AUSTRALIA/ NZ EUROPE
GAMESTOP OPERATING EARNINGS GROWTH
$100,000,000
$200,000,000
$300,000,000
$400,000,000
$500,000,000
$600,000,000
2005
192,700,000
2006
333,700,000
2007
501,400,000
FISCAL YEAR
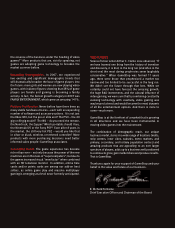
1,036
$1,000
$2,000
$3,000
$4,000
$5,000
$6,000
$7,000
$8,000
1998
1,311
1999
1,560
2000
2,180
2001
3,167
2003
3,827
2004
4,394
2005
5,319
2006
7,094
20072002
2,662
FISCAL YEAR
ANNUAL REVENUE (IN MILLIONS)
GAMESTOP REVENUE GROWTH*
GAMESTOP EARNINGS PER SHARE GROWTH**
2003
$0.53
2004
$0.53
2005
$0.81
2006
$1.00
2007
$1.75
$2.00
$1.00
$0.50
$-
$1.50
* Pro forma revenues of GameStop and EB Games combined for 1998-2005.
** All per share data has been adjusted to reflect the 2-for-1 stock split and Class B share conversion.
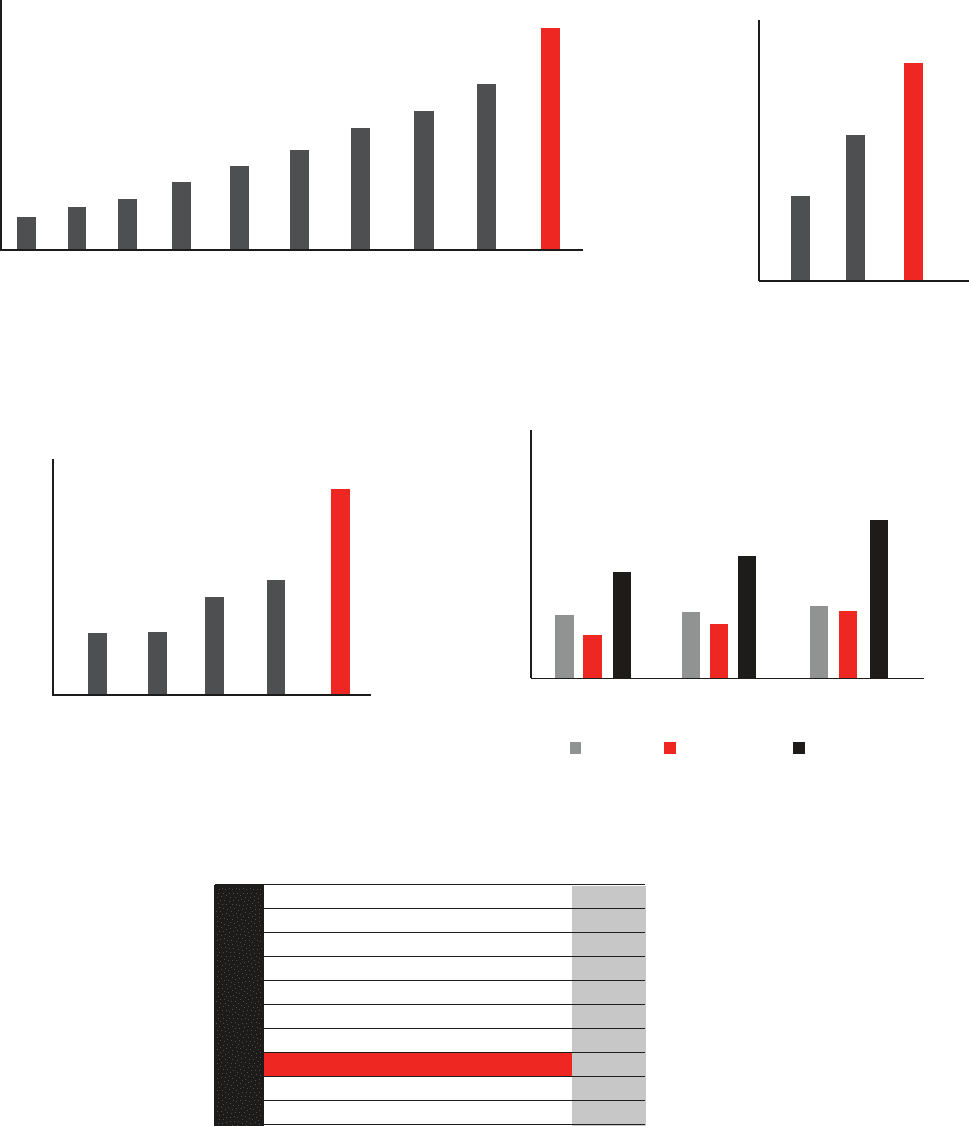
*** May 5, 2008 edition of Fortune Magazine based on 2007 performance.
RANK COMPANY RETURN
1 MOSAIC 341.7%
2 AK STEEL HOLDING 173.6%
3 OWENS-ILLINOIS 168.3%
4 NATIONAL OILWELL VARCO 140.1%
5 AMAZON.COM 134.8%
6 JACOBS ENGINEERING GROUP 134.5%
7 APPLE 133.5%
8 GAMESTOP 125.4%
9 AGCO 119.7%
10 CUMMINS 117.5%
BEST INVESTMENTS AS REPORTED BY FORTUNE MAGAZINE***
2007 STOCK APPRECIATION