GE 2013 Annual Report Download - page 98
Download and view the complete annual report
Please find page 98 of the 2013 GE annual report below. You can navigate through the pages in the report by either clicking on the pages listed below, or by using the keyword search tool below to find specific information within the annual report.-
 1
1 -
2
-
3
-
4
-
5
-
6
-
7
-
8
-
9
-
10
-
11
-
12
-
13
-
14
-
15
-
16
-
17
-
18
-
19
-
20
-
21
-
22
-
23
-
24
-
25
-
26
-
27
-
28
-
29
-
30
-
31
-
32
-
33
-
34
-
35
-
36
-
37
-
38
-
39
-
40
-
41
-
42
-
43
-
44
-
45
-
46
-
47
-
48
-
49
-
50
-
51
-
52
-
53
-
54
-
55
-
56
-
57
-
58
-
59
-
60
-
61
-
62
-
63
-
64
-
65
-
66
-
67
-
68
-
69
-
70
-
71
-
72
-
73
-
74
-
75
-
76
-
77
-
78
-
79
-
80
-
81
-
82
-
83
-
84
-
85
-
86
-
87
-
 88
88 -
 89
89 -
 90
90 -
 91
91 -
 92
92 -
 93
93 -
 94
94 -
 95
95 -
 96
96 -
 97
97 -
 98
98 -
 99
99 -
 100
100 -
 101
101 -
 102
102 -
 103
103 -
 104
104 -
 105
105 -
 106
106 -
 107
107 -
 108
108 -
109
-
110
-
111
-
112
-
113
-
114
-
115
-
116
-
117
-
118
-
119
-
120
-
121
-
122
-
123
-
124
-
125
-
126
-
127
-
128
-
129
-
130
-
131
-
132
-
133
-
134
-
135
-
136
-
137
-
138
-
139
-
140
-
141
-
142
-
143
-
144
-
145
-
146
-
147
-
148
-
149
-
150
 |
 |

96 GE 2013 ANNUAL REPORT
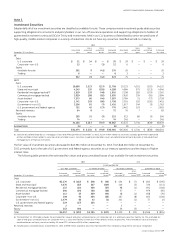
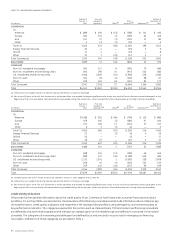
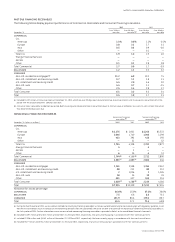
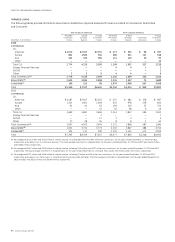
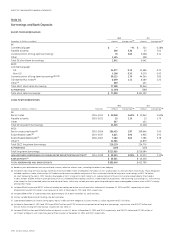
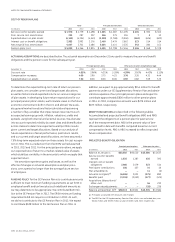
IMPAIRED LOANS
The following tables provide information about loans classifi ed as impaired and specifi c reserves related to Commercial, Real Estate
and Consumer.
With no specific allowance With a specific allowance
December 31 (In millions)
Recorded
investment
in loans
Unpaid
principal
balance
Average
investment
in loans
Recorded
investment
in loans
Unpaid
principal
balance
Associated
allowance
Average
investment
in loans
2013
COMMERCIAL
CLL
Americas $ 1,670 $ 2,187 $ 2,154 $ 417 $ 505 $ 96 $ 497
Europe 802 1,589 956 580 921 211 536
Asia 302 349 180 111 125 20 93
Other — — — — — — 12
Total CLL 2,774 4,125 3,290 1,108 1,551 327 1,138
Energy Financial Services — — — 4 4 1 2
GECAS — — — — — — 1
Other 2 3 9 4 4 — 5
Total Commercial (a) 2,776 4,128 3,299 1,116 1,559 328 1,146
REAL ESTATE (b) 2,615 3,036 3,058 1,245 1,507 74 1,688
CONSUMER (c) 109 153 98 2,879 2,948 567 3,058
Total $ 5,500 $ 7,317 $ 6,455 $ 5,240 $ 6,014 $ 969 $ 5,892
2012
COMMERCIAL
CLL
Americas $ 2,487 $ 2,927 $ 2,535 $ 557 $ 681 $ 178 $ 987
Europe 1,131 1,901 1,009 643 978 278 805
Asia 62 64 62 109 120 23 134
Other — — 43 52 68 6 16
Total CLL 3,680 4,892 3,649 1,361 1,847 485 1,942
Energy Financial Services — — 2 — — — 7
GECAS — — 17 3 3 — 5
Other 17 28 26 8 8 2 40
Total Commercial (a) 3,697 4,920 3,694 1,372 1,858 487 1,994
REAL ESTATE (b) 3,491 3,712 3,773 2,202 2,807 188 3,752
CONSUMER (c) 105 117 100 3,103 3,141 673 2,949
Total $ 7,293 $ 8,749 $ 7,567 $ 6,677 $ 7,806 $ 1,348 $ 8,695
(a) We recognized $218 million and $253 million of interest income, including $60 million and $92 million on a cash basis, for the years ended December 31, 2013 and 2012,
respectively, principally in our CLL Americas business. The total average investment in impaired loans for the years ended December 31, 2013 and 2012 was $4,445 million
and $5,688 million, respectively.
(b) We recognized $187 million and $329 million of interest income, including $135 million and $237 million on a cash basis, for the years ended December 31, 2013 and 2012,
respectively. The total average investment in impaired loans for the years ended December 31, 2013 and 2012 was $4,746 million and $7,525 million, respectively.
(c) We recognized $221 million and $168 million of interest income, including $3 million and $4 million on a cash basis, for the years ended December 31, 2013 and 2012,
respectively, principally in our Consumer-U.S. installment and revolving credit portfolios. The total average investment in impaired loans for the years ended December 31,
2013 and 2012 was $3,156 million and $3,049 million, respectively.