GE 2013 Annual Report Download - page 65
Download and view the complete annual report
Please find page 65 of the 2013 GE annual report below. You can navigate through the pages in the report by either clicking on the pages listed below, or by using the keyword search tool below to find specific information within the annual report.-
 1
1 -
2
-
3
-
4
-
5
-
6
-
7
-
8
-
9
-
10
-
11
-
12
-
13
-
14
-
15
-
16
-
17
-
18
-
19
-
20
-
21
-
22
-
23
-
24
-
25
-
26
-
27
-
28
-
29
-
30
-
31
-
32
-
33
-
34
-
35
-
36
-
37
-
38
-
39
-
40
-
41
-
42
-
43
-
44
-
45
-
46
-
47
-
48
-
49
-
50
-
51
-
52
-
53
-
54
-
 55
55 -
 56
56 -
 57
57 -
 58
58 -
 59
59 -
 60
60 -
 61
61 -
 62
62 -
 63
63 -
 64
64 -
 65
65 -
 66
66 -
 67
67 -
 68
68 -
 69
69 -
 70
70 -
 71
71 -
 72
72 -
 73
73 -
 74
74 -
 75
75 -
76
-
77
-
78
-
79
-
80
-
81
-
82
-
83
-
84
-
85
-
86
-
87
-
88
-
89
-
90
-
91
-
92
-
93
-
94
-
95
-
96
-
97
-
98
-
99
-
100
-
101
-
102
-
103
-
104
-
105
-
106
-
107
-
108
-
109
-
110
-
111
-
112
-
113
-
114
-
115
-
116
-
117
-
118
-
119
-
120
-
121
-
122
-
123
-
124
-
125
-
126
-
127
-
128
-
129
-
130
-
131
-
132
-
133
-
134
-
135
-
136
-
137
-
138
-
139
-
140
-
141
-
142
-
143
-
144
-
145
-
146
-
147
-
148
-
149
-
150
 |
 |

’
GE 2013 ANNUAL REPORT 63
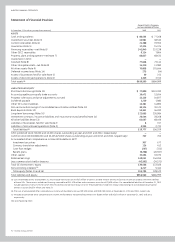
of $5.2 billion, partially offset by increases in other liabilities of
$1.8 billion and accounts payable of $1.0 billion.
Cash from operating activities increased $1.1 billion during
2012 compared with 2011, primarily due to increases in net cash
collateral held from counterparties on derivative contracts of
$1.7 billion, partially offset by decreases in accounts payable of
$0.9 billion.
Consistent with our plan to reduce GECC asset levels, cash
from investing activities was $23.4 billion, $14.7 billion and
$29.8 billion in 2013, 2012 and 2011, respectively. GECC cash
from investing activities increased $8.7 billion during 2013
compared with 2012, primarily due to higher proceeds from
sales of real estate properties of $7.3 billion; the acquisition of
MetLife Bank, N.A. in 2013, resulting in net cash provided from
the acquisition of $6.4 billion; lower net purchases of ELTO of
$1.6 billion; partially offset by lower net loan repayments from
our equity method investments of $4.9 billion and lower collec-
tions (which includes sales) exceeding originations of fi nancing
receivables of $1.9 billion.
GECC cash from investing activities decreased $15.1 billion
during 2012 compared with 2011, primarily due to lower
collections (which includes sales) exceeding originations of
fi nancing receivables of $9.0 billion and lower proceeds from
sales of discontinued operations of $8.7 billion, and higher
net purchases of ELTO of $1.7 billion. These decreases were
partially offset by higher net dispositions and maturities of
investment securities of $2.6 billion and a decrease in all other
assets—investments of $1.7 billion driven by net activity of our
equity method investments.
GECC cash used for fi nancing activities was $29.4 billion,
$52.5 billion and $33.2 billion in 2013, 2012 and 2011, respectively.
GECC cash used for fi nancing activities decreased $23.0 billion
during 2013 compared with 2012, primarily due to lower net
repayments of borrowings of $24.0 billion, consisting primarily of
net reductions in long-term borrowings and commercial paper,
and lower redemptions of guaranteed investment contracts of
$2.3 billion, partially offset by lower proceeds from the issuance
of preferred stock of $3.0 billion.
GECC cash used for fi nancing activities increased $19.3 billion
during 2012 compared with 2011, primarily due to a reduction in
total borrowings of $11.7 billion, consisting primarily of net reduc-
tions in long-term borrowings and commercial paper; $6.5 billion
of dividends paid to shareowners in 2012 (including $0.1 billion
paid to preferred shareowners); a reduction in bank deposits
of $4.2 billion and $1.0 billion of redemptions of guaranteed
investment contracts at Trinity, partially offset by $4.0 billion of
proceeds from the issuance of preferred stock.
GECC pays dividends to GE through a distribution of its
retained earnings, including special dividends from proceeds of
certain business sales. Beginning in the second quarter of 2012,
GECC restarted its dividend to GE. During 2013 and 2012, GECC
paid quarterly dividends of $1.9 billion in both years and special
dividends of $4.1 billion and $4.5 billion, respectively, to GE. No
dividends were paid to GE in 2011.
Intercompany Eliminations
Effects of transactions between related companies are made
on an arms-length basis, are eliminated and consist primarily of
GECC dividends to GE; GE customer receivables sold to GECC;
GECC services for trade receivables management and material
procurement; buildings and equipment (including automobiles)
leased between GE and GECC; information technology (IT) and
other services sold to GECC by GE; aircraft engines manufactured
by GE that are installed on aircraft purchased by GECC from third-
party producers for lease to others; and various investments,
loans and allocations of GE corporate overhead costs. For further
information related to intercompany eliminations, see Note 26.
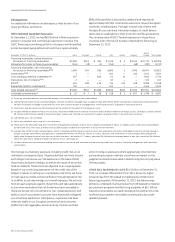
Contractual Obligations
As defi ned by reporting regulations, our contractual obligations for future payments as of December 31, 2013, follow.
Payments due by period
(In billions) Total 2014 2015–2016 2017–2018
2019 and
thereafter
Borrowings and bank deposits (Note 10) $ 383.0 $ 116.7 $ 103.4 $ 59.4 $ 103.5
Interest on borrowings and bank deposits 91.4 9.6 14.0 10.7 57.1
Purchase obligations (a) (b) 67.5 34.2 10.0 9.9 13.4
Insurance liabilities (Note 11) (c) 13.5 1.8 2.1 1.7 7.9
Operating lease obligations (Note 19) 4.3 0.9 1.4 1.0 1.0
Other liabilities (d) 86.7 22.1 9.7 6.4 48.5
Contractual obligations of discontinued operations (e) 3.3 3.3 — — —
(a) Included all take-or-pay arrangements, capital expenditures, contractual commitments to purchase equipment that will be leased to others, contractual commitments
related to factoring agreements, software acquisition/license commitments, contractual minimum programming commitments and any contractually required cash
payments for acquisitions.
(b) Excluded funding commitments entered into in the ordinary course of business by our financial services businesses. Further information on these commitments and other
guarantees is provided in Note 24.
(c) Included contracts with reasonably determinable cash flows such as structured settlements, guaranteed investment contracts, and certain property and casualty
contracts, and excluded long-term care, variable annuity and other life insurance contracts.
(d) Included an estimate of future expected funding requirements related to our pension and postretirement benefit plans and included liabilities for unrecognized tax
benefits. Because their future cash outflows are uncertain, the following non-current liabilities are excluded from the table above: deferred taxes, derivatives, deferred
revenue and other sundry items. For further information on certain of these items, see Notes 14 and 22.
(e) Included payments for other liabilities.