GE 2013 Annual Report Download - page 58
Download and view the complete annual report
Please find page 58 of the 2013 GE annual report below. You can navigate through the pages in the report by either clicking on the pages listed below, or by using the keyword search tool below to find specific information within the annual report.-
 1
1 -
2
-
3
-
4
-
5
-
6
-
7
-
8
-
9
-
10
-
11
-
12
-
13
-
14
-
15
-
16
-
17
-
18
-
19
-
20
-
21
-
22
-
23
-
24
-
25
-
26
-
27
-
28
-
29
-
30
-
31
-
32
-
33
-
34
-
35
-
36
-
37
-
38
-
39
-
40
-
41
-
42
-
43
-
44
-
45
-
46
-
47
-
 48
48 -
 49
49 -
 50
50 -
 51
51 -
 52
52 -
 53
53 -
 54
54 -
 55
55 -
 56
56 -
 57
57 -
 58
58 -
 59
59 -
 60
60 -
 61
61 -
 62
62 -
 63
63 -
 64
64 -
 65
65 -
 66
66 -
 67
67 -
 68
68 -
69
-
70
-
71
-
72
-
73
-
74
-
75
-
76
-
77
-
78
-
79
-
80
-
81
-
82
-
83
-
84
-
85
-
86
-
87
-
88
-
89
-
90
-
91
-
92
-
93
-
94
-
95
-
96
-
97
-
98
-
99
-
100
-
101
-
102
-
103
-
104
-
105
-
106
-
107
-
108
-
109
-
110
-
111
-
112
-
113
-
114
-
115
-
116
-
117
-
118
-
119
-
120
-
121
-
122
-
123
-
124
-
125
-
126
-
127
-
128
-
129
-
130
-
131
-
132
-
133
-
134
-
135
-
136
-
137
-
138
-
139
-
140
-
141
-
142
-
143
-
144
-
145
-
146
-
147
-
148
-
149
-
150
 |
 |

’
56 GE 2013 ANNUAL REPORT
Delinquencies
For additional information on delinquency rates at each of our
major portfolios, see Note 6.
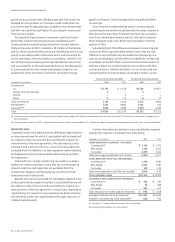
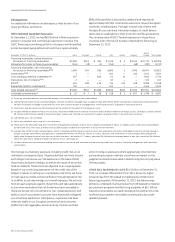
GECC Selected European Exposures
At December 31, 2013, we had $81.8 billion in fi nancing receiv-
ables to consumer and commercial customers in Europe. The
GECC fi nancing receivables portfolio in Europe is well diversifi ed
across European geographies and customers. Approximately
88% of the portfolio is secured by collateral and represents
approximately 500,000 commercial customers. Several European
countries, including Spain, Portugal, Ireland, Italy, Greece and
Hungary (focus countries), have been subject to credit deterio-
ration due to weaknesses in their economic and fi scal situations.
The carrying value of GECC funded exposures in these focus
countries and in the rest of Europe comprised the following at
December 31, 2013.
December 31, 2013 (In millions) Spain Portugal Ireland Italy Greece Hungary
Rest of
Europe Total Europe
Financing receivables, before allowance
for losses on financing receivables $ 1,605 $ 262 $ 290 $ 7,149 $ 5 $ 3,014 $ 70,734 $ 83,059
Allowance for losses on financing receivables (106) (18) (4) (254) — (68) (787) (1,237)
Financing receivables, net of allowance
for losses on financing receivables (a) (b) 1,499 244 286 6,895 5 2,946 69,947 81,822
Investments (c) (d) 3 — — 461 — 246 2,211 2,921
Cost and equity method investments (e) 307 — 383 61 35 — 1,940 2,726
Derivatives, net of collateral (c) (f) 2 — — 63 — — 102 167
ELTO (g) 401 108 419 754 242 328 9,286 11,538
Real estate held for investment (g) 793 — — 422 — — 4,455 5,670
Total funded exposures (h) $ 3,005 $ 352 $ 1,088 $ 8,656 $ 282 $ 3,520 $ 87,941 $ 104,844
Unfunded commitments (i) $ 20 $ 7 $ 38 $ 218 $ 3 $ 827 $ 5,784 $ 6,897
(a) Financing receivable amounts are classified based on the location or nature of the related obligor.
(b) Substantially all relates to non-sovereign obligors. Includes residential mortgage loans of approximately $30.2 billion before consideration of purchased credit protection.
We have third-party mortgage insurance for less than 10% of these residential mortgage loans, which were primarily originated in France and the U.K.
(c) Investments and derivatives are classified based on the location of the parent of the obligor or issuer.
(d) Includes $0.8 billion related to financial institutions, $0.2 billion related to non-financial institutions and $1.9 billion related to sovereign issuers. Sovereign issuances totaled
$0.1 billion and $0.2 billion related to Italy and Hungary, respectively. We held no investments issued by sovereign entities in the other focus countries.
(e) Substantially all is non-sovereign.
(f) Net of cash collateral; entire amount is non-sovereign.
(g) These assets are held under long-term investment and operating strategies, and our ELTO strategies contemplate an ability to redeploy assets under lease should default
by the lessee occur. The values of these assets could be subject to decline or impairment in the current environment.
(h) Excludes $34.4 billion of cash and equivalents, which is composed of $19.6 billion of cash on short-term placement with highly rated global financial institutions based in
Europe, sovereign central banks and agencies or supranational entities, of which $1.7 billion is in focus countries, and $14.8 billion of cash and equivalents placed with
highly rated European financial institutions on a short-term basis, secured by U.S. Treasury securities ($8.4 billion) and sovereign bonds of non-focus countries ($6.4 billion),
where the value of our collateral exceeds the amount of our cash exposure.
(i) Includes ordinary course of business lending commitments, commercial and consumer unused revolving credit lines, inventory financing arrangements and investment
commitments.
We manage counterparty exposure, including credit risk, on an
individual counterparty basis. We place defi ned risk limits around
each obligor and review our risk exposure on the basis of both
the primary and parent obligor, as well as the issuer of securities
held as collateral. These limits are adjusted on an ongoing basis
based on our continuing assessment of the credit risk of the
obligor or issuer. In setting our counterparty risk limits, we focus
on high-quality credits and diversifi cation through spread of risk
in an effort to actively manage our overall exposure. We actively
monitor each exposure against these limits and take appropriate
action when we believe that risk limits have been exceeded or
there are excess risk concentrations. Our collateral position and
ability to work out problem accounts have historically mitigated
our actual loss experience. Delinquency experience has been
relatively stable in our European commercial and consumer
platforms in the aggregate, and we actively monitor and take
action to reduce exposures where appropriate. Uncertainties
surrounding European markets could have an impact on the
judgments and estimates used in determining the carrying value
of these assets.
OTHER GECC RECEIVABLES totaled $16.5 billion at December 31,
2013, an increase of $2.6 billion from 2012, driven by higher
amounts due from GE related to material procurement and
factoring programs. At December 31, 2013, the balance was
primarily composed of amounts due from GE (related to material
procurement programs and factoring programs of $6.7 billion),
insurance receivables, accrued interest and investment income,
nonfi nancing customer receivables and amounts due under
operating leases.