GE 2013 Annual Report Download - page 64
Download and view the complete annual report
Please find page 64 of the 2013 GE annual report below. You can navigate through the pages in the report by either clicking on the pages listed below, or by using the keyword search tool below to find specific information within the annual report.-
 1
1 -
2
-
3
-
4
-
5
-
6
-
7
-
8
-
9
-
10
-
11
-
12
-
13
-
14
-
15
-
16
-
17
-
18
-
19
-
20
-
21
-
22
-
23
-
24
-
25
-
26
-
27
-
28
-
29
-
30
-
31
-
32
-
33
-
34
-
35
-
36
-
37
-
38
-
39
-
40
-
41
-
42
-
43
-
44
-
45
-
46
-
47
-
48
-
49
-
50
-
51
-
52
-
53
-
 54
54 -
 55
55 -
 56
56 -
 57
57 -
 58
58 -
 59
59 -
 60
60 -
 61
61 -
 62
62 -
 63
63 -
 64
64 -
 65
65 -
 66
66 -
 67
67 -
 68
68 -
 69
69 -
 70
70 -
 71
71 -
 72
72 -
 73
73 -
 74
74 -
75
-
76
-
77
-
78
-
79
-
80
-
81
-
82
-
83
-
84
-
85
-
86
-
87
-
88
-
89
-
90
-
91
-
92
-
93
-
94
-
95
-
96
-
97
-
98
-
99
-
100
-
101
-
102
-
103
-
104
-
105
-
106
-
107
-
108
-
109
-
110
-
111
-
112
-
113
-
114
-
115
-
116
-
117
-
118
-
119
-
120
-
121
-
122
-
123
-
124
-
125
-
126
-
127
-
128
-
129
-
130
-
131
-
132
-
133
-
134
-
135
-
136
-
137
-
138
-
139
-
140
-
141
-
142
-
143
-
144
-
145
-
146
-
147
-
148
-
149
-
150
 |
 |

’
62 GE 2013 ANNUAL REPORT
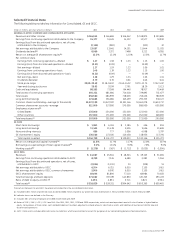
We evaluate our cash fl ow performance by reviewing our
industrial (non-fi nancial services) businesses and fi nancial ser-
vices businesses separately. Cash from operating activities (CFOA)
is the principal source of cash generation for our industrial busi-
nesses. The industrial businesses also have liquidity available via
the public capital markets. Our fi nancial services businesses use
a variety of fi nancial resources to meet our capital needs. Cash
for fi nancial services businesses is primarily provided from the
issuance of term debt and commercial paper in the public and
private markets and deposits, as well as fi nancing receivables col-
lections, sales and securitizations.
GE Cash Flows
GE cash and equivalents were $13.7 billion at December 31, 2013
compared with $15.5 billion at December 31, 2012. GE CFOA
totaled $14.3 billion, $17.8 billion and $12.1 billion in 2013, 2012
and 2011, respectively. With respect to GE CFOA, we believe that
it is useful to supplement our GE Statement of Cash Flows and to
examine in a broader context the business activities that provide
and require cash.
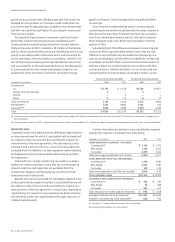
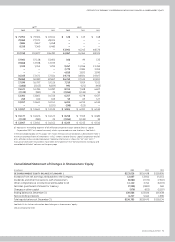
For the years ended December 31 (In billions) 2013 2012 2011
Operating cash collections (a) $ 104.8 $ 105.4 $ 93.6
Operating cash payments (96.5) (94.0) (81.5)
Cash dividends from GECC 6.0 6.4 —
GE cash from operating activities
(GE CFOA) (a) $ 14.3 $ 17.8 $ 12.1
(a) GE sells customer receivables to GECC in part to fund the growth of our
industrial businesses. These transactions can result in cash generation or cash
use. During any given period, GE receives cash from the sale of receivables to
GECC. It also foregoes collection of cash on receivables sold. The incremental
amount of cash received from sale of receivables in excess of the cash GE would
have otherwise collected had those receivables not been sold, represents the
cash generated or used in the period relating to this activity. The incremental
cash generated in GE CFOA from selling these receivables to GECC increased
GE’s CFOA by $0.1 billion, $1.9 billion and $1.2 billion in 2013, 2012 and 2011,
respectively. See Note 26 for additional information about the elimination of
intercompany transactions between GE and GECC.
The most signifi cant source of cash in GE CFOA is customer-
related activities, the largest of which is collecting cash resulting
from product or services sales. GE operating cash collections
decreased by $0.6 billion in 2013 compared with an increase of
$11.8 billion in 2012. In 2013, these changes are consistent with a
decrease in collections on long-term contracts and increases in
current receivables, partially offset by increased progress collec-
tions and improved segment revenues, including the impact of
acquisitions, primarily at Aviation and Oil & Gas. In 2012, these
changes are consistent with the changes in comparable GE
segment revenues, including the impact of acquisitions, primarily
at Oil & Gas and Energy Management. Analyses of segment
revenues discussed in the preceding Segment Operations section
provide additional information regarding our CFOA.
The most signifi cant operating use of cash is to pay our sup-
pliers, employees, tax authorities and others for a wide range of
material and services. GE operating cash payments increased
by $2.5 billion and $12.5 billion in 2013 and 2012, respectively.
In 2013, these changes are consistent with NBCU deal-related
tax payments and payouts under our long-term incentive plan,
partially offset by the non-recurrence of principal pension plan
funding. In 2012, these changes are consistent with the changes
in GE total costs and expenses, including the impact of acquisi-
tions, primarily at Oil & Gas and Energy Management.
Dividends from GECC, including special dividends, represent
the distribution of a portion of GECC retained earnings, and are
distinct from cash from continuing operating activities within the
fi nancial services businesses. The amounts we show in GE CFOA
are the total dividends, including special dividends from excess
capital. Beginning in the second quarter of 2012, GECC restarted
its dividend to GE. GECC paid quarterly dividends of $1.9 billion in
both 2013 and 2012. In addition, GECC paid special dividends of
$4.1 billion and $4.5 billion in 2013 and 2012, respectively, to GE.
There were no dividends received from GECC in 2011.
GE cash from investing activities was $4.8 billion for 2013
compared with cash used of $5.4 billion and $8.2 billion for 2012
and 2011, respectively. GE cash fl ows from investing activities
increased $10.2 billion during 2013 compared with 2012, pri-
marily due to proceeds of $16.7 billion from the 2013 sale of our
remaining 49% common equity interest in NBCU LLC to Comcast,
partially offset by the 2013 acquisitions of Avio for $4.4 billion and
Lufkin for $3.3 billion.
GE cash used for investing activities decreased by $2.8 bil-
lion during 2012 compared with 2011 primarily due to decreased
business acquisition activity of $9.7 billion driven by 2011 acqui-
sitions of Converteam, the Well Support division of John Wood
Group PLC, Dresser, Inc., Wellstream PLC and Lineage Power
Holdings, Inc. This was offset by decreased business disposition
activity of $5.7 billion driven by cash received in 2011 related to
the formation of NBCU LLC ($6.2 billion) and an increase in addi-
tions to property, plant and equipment of $1.0 billion in 2012.
GE cash used for fi nancing activities was $20.9 billion, $5.3 bil-
lion and $14.6 billion for 2013, 2012 and 2011, respectively.
Cash used for fi nancing activities increased $15.6 billion com-
pared with 2012, primarily as a result of our 2013 repayment of
$5.0 billion of GE unsecured notes compared with an issuance
of $7.0 billion of notes in 2012. Additionally, increases in cash
used in 2013 were a result of increased repurchases of GE shares
for treasury in accordance with our share repurchase program
of $5.2 billion and increased dividends paid to shareowners of
$0.6 billion in 2013.
GE cash used for fi nancing activities decreased $9.3 billion
compared with 2011 primarily due to an issuance of $7.0 billion of
notes in 2012 and non-recurrence of two transactions from 2011.
In 2011, prior to the formation of NBCU LLC, GE purchased the
remaining shares of Vivendi S.A.’s 12.3% interest in NBC Universal
for $3.9 billion. Additionally, GE redeemed preferred shares from
Berkshire Hathaway Inc. at a redemption price of $3.3 billion.
The impacts of these 2011 transactions were partially offset by
increased repurchases of GE shares for treasury in accordance
with our share repurchase program of $2.9 billion and increased
dividends paid to shareowners of $0.7 billion in 2012.
GECC Cash Flows
GECC cash from operating activities totaled $19.9 billion,
$21.7 billion and $20.6 billion in 2013, 2012 and 2011, respectively.
Cash from operating activities decreased $1.9 billion during
2013 compared with 2012, primarily due to decreases in net
cash collateral held from counterparties on derivative contracts