GE 2013 Annual Report Download - page 127
Download and view the complete annual report
Please find page 127 of the 2013 GE annual report below. You can navigate through the pages in the report by either clicking on the pages listed below, or by using the keyword search tool below to find specific information within the annual report.-
 1
1 -
2
-
3
-
4
-
5
-
6
-
7
-
8
-
9
-
10
-
11
-
12
-
13
-
14
-
15
-
16
-
17
-
18
-
19
-
20
-
21
-
22
-
23
-
24
-
25
-
26
-
27
-
28
-
29
-
30
-
31
-
32
-
33
-
34
-
35
-
36
-
37
-
38
-
39
-
40
-
41
-
42
-
43
-
44
-
45
-
46
-
47
-
48
-
49
-
50
-
51
-
52
-
53
-
54
-
55
-
56
-
57
-
58
-
59
-
60
-
61
-
62
-
63
-
64
-
65
-
66
-
67
-
68
-
69
-
70
-
71
-
72
-
73
-
74
-
75
-
76
-
77
-
78
-
79
-
80
-
81
-
82
-
83
-
84
-
85
-
86
-
87
-
88
-
89
-
90
-
91
-
92
-
93
-
94
-
95
-
96
-
97
-
98
-
99
-
100
-
101
-
102
-
103
-
104
-
105
-
106
-
107
-
108
-
109
-
110
-
111
-
112
-
113
-
114
-
115
-
116
-
 117
117 -
 118
118 -
 119
119 -
 120
120 -
 121
121 -
 122
122 -
 123
123 -
 124
124 -
 125
125 -
 126
126 -
 127
127 -
 128
128 -
 129
129 -
 130
130 -
 131
131 -
 132
132 -
 133
133 -
 134
134 -
 135
135 -
 136
136 -
 137
137 -
138
-
139
-
140
-
141
-
142
-
143
-
144
-
145
-
146
-
147
-
148
-
149
-
150
 |
 |

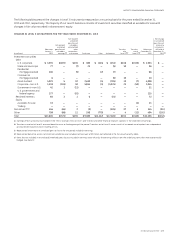
GE 2013 ANNUAL REPORT 125
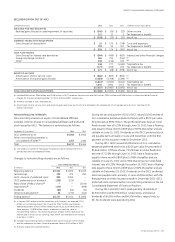
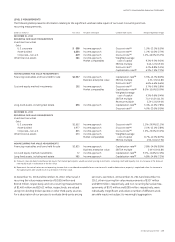
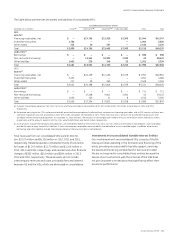
LEVEL 3 MEASUREMENTS
The following table presents information relating to the signifi cant unobservable inputs of our Level 3 recurring and non-
recurring measurements.
(Dollars in millions) Fair value Valuation technique Unobservable inputs Range (weighted average)
DECEMBER 31, 2013
RECURRING FAIR VALUE MEASUREMENTS
Investment securities
Debt
U.S. corporate $ 898 Income approach Discount rate (a) 1.5%–13.3% (6.5%)
Asset-backed 6,854 Income approach Discount rate (a) 1.2%–10.5% (3.7%)
Corporate—non-U.S. 819 Income approach Discount rate (a) 1.4%–46.0% (15.1%)
Other financial assets 381 Income approach,
Market comparables
Weighted average
cost of capital 9.3%–9.3% (9.3%)
EBITDA multiple 5.4X–12.5X (9.5X)
Discount rate (a) 5.2%–8.8% (5.3%)
Capitalization rate (b) 6.3%–7.5% (7.2%)
NON-RECURRING FAIR VALUE MEASUREMENTS
Financing receivables and loans held for sale $ 1,937 Income approach, Capitalization rate (b) 5.5%–16.7% (8.0%)
Business enterprise value EBITDA multiple 4.3X–5.5X (4.8X)
Discount rate (a) 6.6%–6.6% (6.6%)
Cost and equity method investments 102 Income approach, Discount rate (a) 5.7%–5.9% (5.8%)
Market comparables Capitalization rate (b) 8.5%–10.6% (10.0%)
Weighted average
cost of capital 9.3%–9.6% (9.4%)
EBITDA multiple 7.1X–14.5X (11.3X)
Revenue multiple 2.2X–12.6X (9.4X)
Long-lived assets, including real estate 694 Income approach Capitalization rate (b) 5.4%–14.5% (7.8%)
Discount rate (a) 4.0%–23.0% (9.0%)
DECEMBER 31, 2012
RECURRING FAIR VALUE MEASUREMENTS
Investment securities
Debt
U.S. corporate $ 1,652 Income approach Discount rate (a) 1.3%–29.9% (11.1%)
Asset-backed 4,977 Income approach Discount rate (a) 2.1%–13.1% (3.8%)
Corporate—non-U.S. 865 Income approach Discount rate (a) 1.5%–25.0% (13.2%)
Other financial assets 633 Income approach,
Market comparables
Weighted average
cost of capital 8.7%–10.2% (8.7%)
EBITDA multiple 4.9X–10.6X (7.9X)
NON-RECURRING FAIR VALUE MEASUREMENTS
Financing receivables and loans held for sale $ 2,835 Income approach, Capitalization rate (b) 3.8%–14.0% (8.0%)
Business enterprise value EBITDA multiple 2.0X–6.0X (4.8X)
Cost and equity method investments 72 Income approach Capitalization rate (b) 9.2%–12.8% (12.0%)
Long-lived assets, including real estate 985 Income approach Capitalization rate (b) 4.8%–14.6% (7.3%)
(a) Discount rates are determined based on inputs that market participants would use when pricing investments, including credit and liquidity risk. An increase in the discount
rate would result in a decrease in the fair value.
(b) Represents the rate of return on net operating income that is considered acceptable for an investor and is used to determine a property’s capitalized value. An increase in
the capitalization rate would result in a decrease in the fair value.
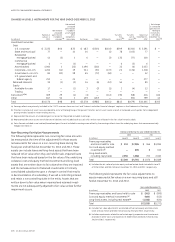
At December 31, 2013 and December 31, 2012, other Level 3
recurring fair value measurements of $2,816 million and
$3,146 million, respectively, and non-recurring measurements
of $1,460 million and $2,412 million, respectively, are valued
using non-binding broker quotes or other third-party sources.
For a description of our process to evaluate third-party pricing
servicers, see Note 1. At December 31, 2013 and December 31,
2012, other recurring fair value measurements of $327 million
and $370 million, respectively, and non-recurring fair value mea-
surements of $571 million and $285 million, respectively, were
individually insignifi cant and utilize a number of different unob-
servable inputs not subject to meaningful aggregation.