GE 2013 Annual Report Download - page 139
Download and view the complete annual report
Please find page 139 of the 2013 GE annual report below. You can navigate through the pages in the report by either clicking on the pages listed below, or by using the keyword search tool below to find specific information within the annual report.-
 1
1 -
2
-
3
-
4
-
5
-
6
-
7
-
8
-
9
-
10
-
11
-
12
-
13
-
14
-
15
-
16
-
17
-
18
-
19
-
20
-
21
-
22
-
23
-
24
-
25
-
26
-
27
-
28
-
29
-
30
-
31
-
32
-
33
-
34
-
35
-
36
-
37
-
38
-
39
-
40
-
41
-
42
-
43
-
44
-
45
-
46
-
47
-
48
-
49
-
50
-
51
-
52
-
53
-
54
-
55
-
56
-
57
-
58
-
59
-
60
-
61
-
62
-
63
-
64
-
65
-
66
-
67
-
68
-
69
-
70
-
71
-
72
-
73
-
74
-
75
-
76
-
77
-
78
-
79
-
80
-
81
-
82
-
83
-
84
-
85
-
86
-
87
-
88
-
89
-
90
-
91
-
92
-
93
-
94
-
95
-
96
-
97
-
98
-
99
-
100
-
101
-
102
-
103
-
104
-
105
-
106
-
107
-
108
-
109
-
110
-
111
-
112
-
113
-
114
-
115
-
116
-
117
-
118
-
119
-
120
-
121
-
122
-
123
-
124
-
125
-
126
-
127
-
128
-
 129
129 -
 130
130 -
 131
131 -
 132
132 -
 133
133 -
 134
134 -
 135
135 -
 136
136 -
 137
137 -
 138
138 -
 139
139 -
 140
140 -
 141
141 -
 142
142 -
 143
143 -
 144
144 -
 145
145 -
 146
146 -
 147
147 -
 148
148 -
 149
149 -
150
 |
 |

GE 2013 ANNUAL REPORT 137
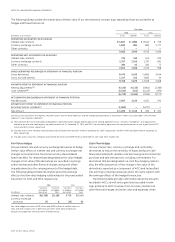
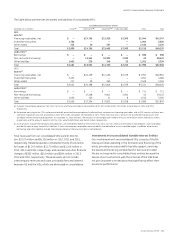
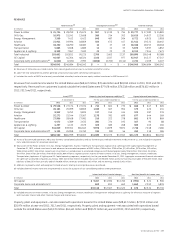
REVENUES
Total revenues (a) Intersegment revenues (b) External revenues
(In millions) 2013 2012 2011 2013 2012 2011 2013 2012 2011
Power & Water $ 24,724 $ 28,299 $ 25,675 $ 947 $ 1,119 $ 794 $ 23,777 $ 27,180 $ 24,881
Oil & Gas 16,975 15,241 13,608 360 314 302 16,615 14,927 13,306
Energy Management 7,569 7,412 6,422 848 487 504 6,721 6,925 5,918
Aviation 21,911 19,994 18,859 500 672 417 21,411 19,322 18,442
Healthcare 18,200 18,290 18,083 14 37 65 18,186 18,253 18,018
Transportation 5,885 5,608 4,885 12 11 33 5,873 5,597 4,852
Appliances & Lighting 8,338 7,967 7,693 25 23 22 8,313 7,944 7,671
Total industrial 103,602 102,811 95,225 2,706 2,663 2,137 100,896 100,148 93,088
GE Capital 44,067 45,364 48,324 1,150 1,037 977 42,917 44,327 47,347
Corporate items and eliminations (c) (1,624) (1,491) 2,993 (3,856) (3,700) (3,114) 2,232 2,209 6,107
Total $ 146,045 $ 146,684 $ 146,542 $ — $ — $ — $ 146,045 $ 146,684 $ 146,542
(a) Revenues of GE businesses include income from sales of goods and services to customers and other income.
(b) Sales from one component to another generally are priced at equivalent commercial selling prices.
(c) Includes the results of NBCU (our formerly consolidated subsidiary) and our former equity method investment in NBCUniversal LLC.
Revenues from customers located in the United States were $68,617 million, $70,466 million and $69,910 million in 2013, 2012 and 2011,
respectively. Revenues from customers located outside the United States were $77,428 million, $76,218 million and $76,632 million in
2013, 2012 and 2011, respectively.
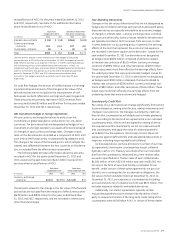
Assets (a) (b) Property, plant and equipment additions (c) Depreciation and amortization
At December 31 For the years ended December 31 For the years ended December 31
(In millions) 2013 2012 2011 2013 2012 2011 2013 2012 2011
Power & Water $ 29,526 $ 27,174 $ 27,074 $ 714 $ 661 $ 770 $ 668 $ 647 $ 605
Oil & Gas 26,181 20,099 18,855 1,185 467 904 479 426 434
Energy Management 9,962 9,253 9,835 137 155 414 323 287 239
Aviation 32,272 25,144 23,567 1,178 781 699 677 644 569
Healthcare 27,956 28,458 27,981 316 322 378 861 879 869
Transportation 4,472 4,389 2,633 282 724 193 167 90 88
Appliances & Lighting 4,237 4,133 3,675 405 485 268 300 265 260
GE Capital 516,829 539,351 584,643 9,978 11,879 9,871 7,738 7,348 7,480
Corporate items and eliminations (d) 5,125 26,998 19,740 194 (99) 56 260 218 186
Total $ 656,560 $ 684,999 $ 718,003 $ 14,389 $ 15,375 $ 13,553 $ 11,473 $ 10,804 $ 10,730
(a) Assets of discontinued operations, NBCU (our formerly consolidated subsidiary) and our former equity method investment in NBCUniversal LLC are included in Corporate
items and eliminations for all periods presented.
(b) Total assets of the Power & Water, Oil & Gas, Energy Management, Aviation, Healthcare, Transportation, Appliances & Lighting and GE Capital operating segments at
December 31, 2013, include investment in and advances to associated companies of $507 million, $108 million, $788 million, $1,463 million, $576 million, $10 million,
$388 million and $17,348 million, respectively. Investments in and advances to associated companies contributed approximately $(26) million, $18 million, $3 million,
$4 million, $(48) million, $0 million, $40 million and $1,809 million to segment pre-tax income of Power & Water, Oil & Gas, Energy Management, Aviation, Healthcare,
Transportation, Appliances & Lighting and GE Capital operating segments, respectively, for the year ended December 31, 2013. Aggregate summarized financial information
for significant associated companies assuming a 100% ownership interest included: total assets of $98,658 million, primarily financing receivables of $46,655 million; total
liabilities of $66,535 million, primarily debt of $40,030 million; revenues totaled $22,692 million; and net earnings totaled $2,431 million.
(c) Additions to property, plant and equipment include amounts relating to principal businesses purchased.
(d) Includes deferred income taxes that are presented as assets for purposes of our consolidating balance sheet presentation.
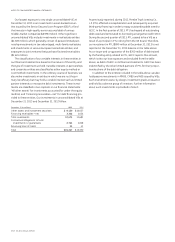
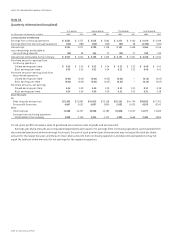
Interest and other financial charges Provision (benefit) for income taxes
(In millions) 2013 2012 2011 2013 2012 2011
GE Capital $ 9,267 $ 11,596 $ 13,760 $ (992) $ 521 $ 906
Corporate items and eliminations (a) 849 811 662 1,668 2,013 4,839
Total $ 10,116 $ 12,407 $ 14,422 $ 676 $ 2,534 $ 5,745
(a) Included amounts for Power & Water, Oil & Gas, Energy Management, Aviation, Healthcare, Transportation and Appliances & Lighting, for which our measure of segment
profit excludes interest and other financial charges and income taxes.
Property, plant and equipment—net associated with operations based in the United States were $28,657 million, $27,192 million and
$25,974 million at year-end 2013, 2012 and 2011, respectively. Property, plant and equipment—net associated with operations based
outside the United States were $40,170 million, $41,441 million and $38,573 million at year-end 2013, 2012 and 2011, respectively.