GE 2013 Annual Report Download - page 74
Download and view the complete annual report
Please find page 74 of the 2013 GE annual report below. You can navigate through the pages in the report by either clicking on the pages listed below, or by using the keyword search tool below to find specific information within the annual report.-
 1
1 -
2
-
3
-
4
-
5
-
6
-
7
-
8
-
9
-
10
-
11
-
12
-
13
-
14
-
15
-
16
-
17
-
18
-
19
-
20
-
21
-
22
-
23
-
24
-
25
-
26
-
27
-
28
-
29
-
30
-
31
-
32
-
33
-
34
-
35
-
36
-
37
-
38
-
39
-
40
-
41
-
42
-
43
-
44
-
45
-
46
-
47
-
48
-
49
-
50
-
51
-
52
-
53
-
54
-
55
-
56
-
57
-
58
-
59
-
60
-
61
-
62
-
63
-
 64
64 -
 65
65 -
 66
66 -
 67
67 -
 68
68 -
 69
69 -
 70
70 -
 71
71 -
 72
72 -
 73
73 -
 74
74 -
 75
75 -
 76
76 -
 77
77 -
 78
78 -
 79
79 -
 80
80 -
 81
81 -
 82
82 -
 83
83 -
 84
84 -
85
-
86
-
87
-
88
-
89
-
90
-
91
-
92
-
93
-
94
-
95
-
96
-
97
-
98
-
99
-
100
-
101
-
102
-
103
-
104
-
105
-
106
-
107
-
108
-
109
-
110
-
111
-
112
-
113
-
114
-
115
-
116
-
117
-
118
-
119
-
120
-
121
-
122
-
123
-
124
-
125
-
126
-
127
-
128
-
129
-
130
-
131
-
132
-
133
-
134
-
135
-
136
-
137
-
138
-
139
-
140
-
141
-
142
-
143
-
144
-
145
-
146
-
147
-
148
-
149
-
150
 |
 |

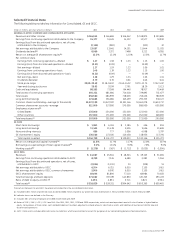
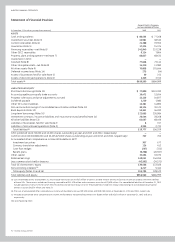
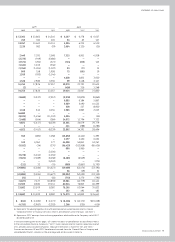
72 GE 2013 ANNUAL REPORT
Statement of Financial Position
General Electric Company
and consolidated affiliates
At December 31 (In millions, except share amounts) 2013 2012
ASSETS
Cash and equivalents $ 88,555 $ 77,268
Investment securities (Note 3) 43,981 48,510
Current receivables (Note 4) 21,388 19,902
Inventories (Note 5) 17,325 15,374
Financing receivables—net (Note 6) 241,940 257,238
Other GECC receivables 9,114 7,864
Property, plant and equipment—net (Note 7) 68,827 68,633
Investment in GECC — —
Goodwill (Note 8) 77,648 73,114
Other intangible assets—net (Note 8) 14,310 11,980
All other assets (Note 9) 70,808 101,644
Deferred income taxes (Note 14) 275 (54)
Assets of businesses held for sale (Note 2) 50 211
Assets of discontinued operations (Note 2) 2,339 3,315
Total assets (a) $ 656,560 $ 684,999
LIABILITIES AND EQUITY
Short-term borrowings (Note 10) $ 77,890 $ 101,392
Accounts payable, principally trade accounts 16,471 15,654
Progress collections and price adjustments accrued 13,125 10,877
Dividends payable 2,220 1,980
Other GE current liabilities 13,381 14,895
Non-recourse borrowings of consolidated securitization entities (Note 10) 30,124 30,123
Bank deposits (Note 10) 53,361 46,200
Long-term borrowings (Note 10) 221,665 236,084
Investment contracts, insurance liabilities and insurance annuity benefits (Note 11) 26,544 28,268
All other liabilities (Note 13) 61,057 68,166
Liabilities of businesses held for sale (Note 2) 6 157
Liabilities of discontinued operations (Note 2) 3,933 2,733
Total liabilities (a) 519,777 556,529
GECC preferred stock (50,000 and 40,000 shares outstanding at year-end 2013 and 2012, respectively) — —
Common stock (10,060,881,000 and 10,405,625,000 shares outstanding at year-end 2013 and 2012, respectively) 702 702
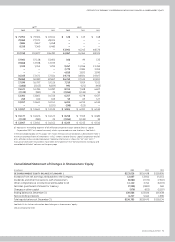
Accumulated other comprehensive income attributable to GE (b)
Investment securities 307 677
Currency translation adjustments 126 412
Cash flow hedges (257) (722)
Benefit plans (9,296) (20,597)
Other capital 32,494 33,070
Retained earnings 149,051 144,055
Less common stock held in treasury (42,561) (34,571)
Total GE shareowners’ equity 130,566 123,026
Noncontrolling interests (c) 6,217 5,444
Total equity (Notes 15 and 16) 136,783 128,470
Total liabilities and equity $ 656,560 $ 684,999
(a) Our consolidated assets at December 31, 2013 include total assets of $47,367 million of certain variable interest entities (VIEs) that can only be used to settle the liabilities
of those VIEs. These assets include net financing receivables of $41,420 million and investment securities of $3,830 million. Our consolidated liabilities at December 31, 2013
include liabilities of certain VIEs for which the VIE creditors do not have recourse to GE. These liabilities include non-recourse borrowings of consolidated securitization
entities (CSEs) of $28,574 million. See Note 23.
(b) The sum of accumulated other comprehensive income attributable to GE was $(9,120) million and $(20,230) million at December 31, 2013 and 2012, respectively.
(c) Included accumulated other comprehensive income attributable to noncontrolling interests of $(180) million and $(155) million at December 31, 2013 and 2012,
respectively.
See accompanying notes.