GE 2013 Annual Report Download - page 95
Download and view the complete annual report
Please find page 95 of the 2013 GE annual report below. You can navigate through the pages in the report by either clicking on the pages listed below, or by using the keyword search tool below to find specific information within the annual report.-
 1
1 -
2
-
3
-
4
-
5
-
6
-
7
-
8
-
9
-
10
-
11
-
12
-
13
-
14
-
15
-
16
-
17
-
18
-
19
-
20
-
21
-
22
-
23
-
24
-
25
-
26
-
27
-
28
-
29
-
30
-
31
-
32
-
33
-
34
-
35
-
36
-
37
-
38
-
39
-
40
-
41
-
42
-
43
-
44
-
45
-
46
-
47
-
48
-
49
-
50
-
51
-
52
-
53
-
54
-
55
-
56
-
57
-
58
-
59
-
60
-
61
-
62
-
63
-
64
-
65
-
66
-
67
-
68
-
69
-
70
-
71
-
72
-
73
-
74
-
75
-
76
-
77
-
78
-
79
-
80
-
81
-
82
-
83
-
84
-
 85
85 -
 86
86 -
 87
87 -
 88
88 -
 89
89 -
 90
90 -
 91
91 -
 92
92 -
 93
93 -
 94
94 -
 95
95 -
 96
96 -
 97
97 -
 98
98 -
 99
99 -
 100
100 -
 101
101 -
 102
102 -
 103
103 -
 104
104 -
 105
105 -
106
-
107
-
108
-
109
-
110
-
111
-
112
-
113
-
114
-
115
-
116
-
117
-
118
-
119
-
120
-
121
-
122
-
123
-
124
-
125
-
126
-
127
-
128
-
129
-
130
-
131
-
132
-
133
-
134
-
135
-
136
-
137
-
138
-
139
-
140
-
141
-
142
-
143
-
144
-
145
-
146
-
147
-
148
-
149
-
150
 |
 |

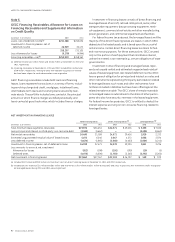
GE 2013 ANNUAL REPORT 93
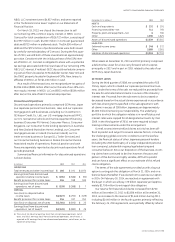
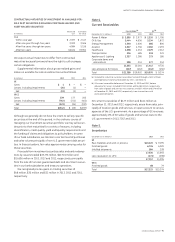
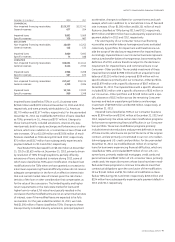
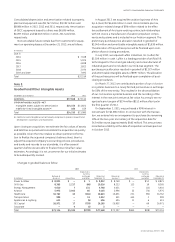
CONTRACTUAL MATURITIES
(In millions) Total loans
Net rentals
receivable
Due in
2014 $ 54,971 $ 8,184
2015 19,270 6,114
2016 19,619 4,209
2017 17,281 2,733
2018 14,714 1,798
2019 and later 43,121 3,452
168,976 26,490
Consumer revolving loans 62,292 —
Total $ 231,268 $ 26,490
We expect actual maturities to differ from contractual maturities.
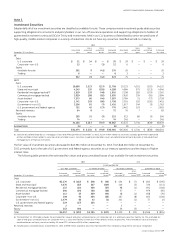
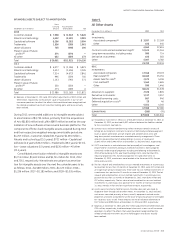
The following tables provide additional information about our
fi nancing receivables and related activity in the allowance for
losses for our Commercial, Real Estate and Consumer portfolios.
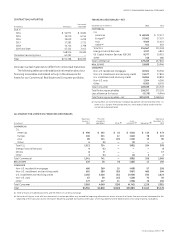
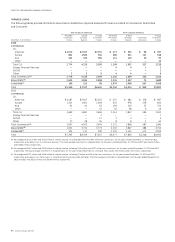
FINANCING RECEIVABLES — NET
December 31 (In millions) 2013 2012
COMMERCIAL
CLL
Americas $ 68,585 $ 72,517
Europe
(a) 37,962 37,037
Asia 9,469 11,401
Other
(a) 451 603
Total CLL 116,467 121,558
Energy Financial Services 3,107 4,851
GE Capital Aviation Services (GECAS) 9,377 10,915
Other 318 486
Total Commercial 129,269 137,810
REAL ESTATE 19,899 20,946
CONSUMER
Non-U.S. residential mortgages 30,501 33,350
Non-U.S. installment and revolving credit 13,677 17,816
U.S. installment and revolving credit 55,854 50,853
Non-U.S. auto 2,054 4,260
Other 6,953 8,070
Total Consumer 109,039 114,349
Total financing receivables 258,207 273,105
Less allowance for losses (5,178) (4,944)
Total financing receivables—net $ 253,029 $ 268,161
(a) During 2013, we transferred our European equipment services portfolio from CLL
Other to CLL Europe. Prior-period amounts were reclassified to conform to the
current period presentation.
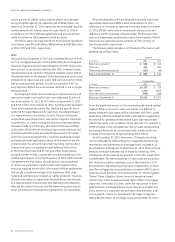
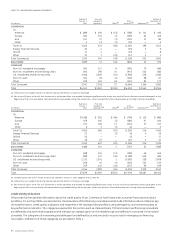
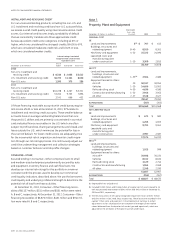
ALLOWANCE FOR LOSSES ON FINANCING RECEIVABLES
(In millions)
Balance at
January 1,
2013
Provision
charged to
operations Other
(a) Gross
write-offs
(b) Recoveries
(b)
Balance at
December 31,
2013
COMMERCIAL
CLL
Americas $ 490 $ 292 $ (1) $ (422) $ 114 $ 473
Europe 445 321 12 (441) 78 415
Asia 80 124 (11) (115) 12 90
Other 6 (3) — (3) — —
Total CLL 1,021 734 — (981) 204 978
Energy Financial Services 9 (1) — — — 8
GECAS 8 9 — — — 17
Other 3 (1) — (2) 2 2
Total Commercial 1,041 741 — (983) 206 1,005
REAL ESTATE 320 28 (4) (163) 11 192
CONSUMER
Non-U.S. residential mortgages 480 269 10 (458) 57 358
Non-U.S. installment and revolving credit 582 589 (93) (967) 483 594
U.S. installment and revolving credit 2,282 3,006 (51) (2,954) 540 2,823
Non-U.S. auto 67 58 (13) (126) 70 56
Other 172 127 11 (236) 76 150
Total Consumer 3,583 4,049 (136) (4,741) 1,226 3,981
Total $ 4,944 $ 4,818 $ (140) $ (5,887) $ 1,443 $ 5,178
(a) Other primarily included dispositions and the effects of currency exchange.
(b) Net write-offs (gross write-offs less recoveries) in certain portfolios may exceed the beginning allowance for losses as a result of losses that are incurred subsequent to the
beginning of the fiscal year due to information becoming available during the current year, which may identify further deterioration on existing financing receivables.