GE 2013 Annual Report Download - page 142
Download and view the complete annual report
Please find page 142 of the 2013 GE annual report below. You can navigate through the pages in the report by either clicking on the pages listed below, or by using the keyword search tool below to find specific information within the annual report.-
 1
1 -
2
-
3
-
4
-
5
-
6
-
7
-
8
-
9
-
10
-
11
-
12
-
13
-
14
-
15
-
16
-
17
-
18
-
19
-
20
-
21
-
22
-
23
-
24
-
25
-
26
-
27
-
28
-
29
-
30
-
31
-
32
-
33
-
34
-
35
-
36
-
37
-
38
-
39
-
40
-
41
-
42
-
43
-
44
-
45
-
46
-
47
-
48
-
49
-
50
-
51
-
52
-
53
-
54
-
55
-
56
-
57
-
58
-
59
-
60
-
61
-
62
-
63
-
64
-
65
-
66
-
67
-
68
-
69
-
70
-
71
-
72
-
73
-
74
-
75
-
76
-
77
-
78
-
79
-
80
-
81
-
82
-
83
-
84
-
85
-
86
-
87
-
88
-
89
-
90
-
91
-
92
-
93
-
94
-
95
-
96
-
97
-
98
-
99
-
100
-
101
-
102
-
103
-
104
-
105
-
106
-
107
-
108
-
109
-
110
-
111
-
112
-
113
-
114
-
115
-
116
-
117
-
118
-
119
-
120
-
121
-
122
-
123
-
124
-
125
-
126
-
127
-
128
-
129
-
130
-
131
-
 132
132 -
 133
133 -
 134
134 -
 135
135 -
 136
136 -
 137
137 -
 138
138 -
 139
139 -
 140
140 -
 141
141 -
 142
142 -
 143
143 -
 144
144 -
 145
145 -
 146
146 -
 147
147 -
 148
148 -
 149
149 -
 150
150
 |
 |

140 GE 2013 ANNUAL REPORT
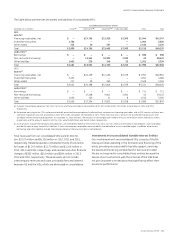
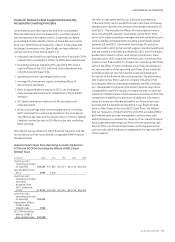
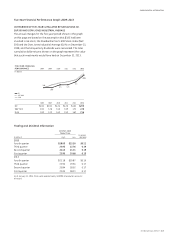
Operating Earnings, Operating EPS and Operating EPS Excluding the Effects of the 2011 Preferred Stock Redemption
(In millions; except earnings per share) 2013 2012 2011 2010 2009
Earnings from continuing operations attributable to GE $ 15,177 $ 14,624 $ 14,122 $ 12,577 $ 10,993
Adjustment (net of tax): non-operating pension costs (income) 1,705 1,386 688 (204) (967)
Operating earnings $ 16,882 $ 16,010 $ 14,810 $ 12,373 $ 10,026
EARNINGS PER SHARE—DILUTED (a)
Continuing earnings per share $ 1.47 $ 1.38 $ 1.23 $ 1.15 $ 1.00
Adjustment (net of tax): non-operating pension costs (income) 0.16 0.13 0.06 (0.02) (0.09)
Operating earnings per share 1.64 1.51 1.30 1.13 0.91
Less effects of the 2011 preferred stock redemption — — 0.08 — —
Operating EPS excluding the effects of the 2011 preferred stock redemption $ 1.64 $ 1.51 $ 1.37 $ 1.13 $ 0.91
(a) Earnings-per-share amounts are computed independently. As a result, the sum of per-share amounts may not equal the total.
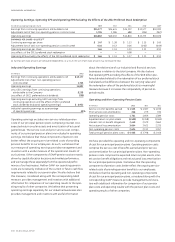
Industrial Operating Earnings
(In millions) 2013
Earnings from continuing operations attributable to GE $ 15,177
Adjustments (net of tax): non-operating pension
costs (income) 1,705
Operating earnings 16,882
Less GECC earnings from continuing operations
attributable to the Company 8,258
Less effect of GECC preferred stock dividends (298)
Operating earnings excluding GECC earnings from
continuing operations and the effect of GECC preferred
stock dividends (Industrial operating earnings) $ 8,922
Industrial operating earnings as a percentage
of operating earnings 53%
Operating earnings excludes non-service-related pension
costs of our principal pension plans comprising interest cost,
expected return on plan assets and amortization of actuarial
gains/losses. The service cost and prior service cost compo-
nents of our principal pension plans are included in operating
earnings. We believe that these components of pension cost
better refl ect the ongoing service-related costs of providing
pension benefi ts to our employees. As such, we believe that
our measure of operating earnings provides management and
investors with a useful measure of the operational results of
our business. Other components of GAAP pension cost are mainly
driven by capital allocation decisions and market performance,
and we manage these separately from the operational perfor-
mance of our businesses. Neither GAAP nor operating pension
costs are necessarily indicative of the current or future cash fl ow
requirements related to our pension plan. We also believe that
this measure, considered along with the corresponding GAAP
measure, provides management and investors with additional
information for comparison of our operating results to the oper-
ating results of other companies. We believe that presenting
operating earnings separately for our industrial businesses also
provides management and investors with useful information
about the relative size of our industrial and fi nancial services
businesses in relation to the total company. We also believe
that operating EPS excluding the effects of the $0.8 billion pre-
ferred dividend related to the redemption of our preferred stock
(calculated as the difference between the carry ing value and
the redemption value of the preferred stock) is a meaningful
measure because it increases the comparability of period-to-
period results.
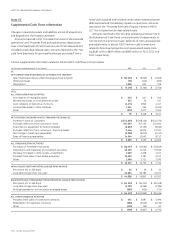
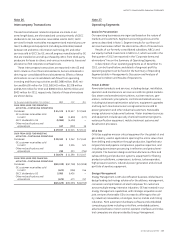
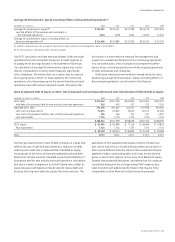
Operating and Non-Operating Pension Costs
(In millions) 2013 2012 2011
Service cost for benefits earned $ 1,535 $ 1,387 $ 1,195
Prior service cost amortization 246 279 194
Operating pension costs 1,781 1,666 1,389
Expected return on plan assets (3,500) (3,768) (3,940)
Interest cost on benefit obligations 2,460 2,479 2,662
Net actuarial loss amortization 3,664 3,421 2,335
Non-operating pension costs 2,624 2,132 1,057
Total principal pension plans costs $ 4,405 $ 3,798 $ 2,446
We have provided the operating and non-operating components
of cost for our principal pension plans. Operating pension costs
comprise the service cost of benefi ts earned and prior service
cost amortization for our principal pension plans. Non-operating
pension costs comprise the expected return on plan assets, inter-
est cost on benefi t obligations and net actuarial loss amortization
for our principal pension plans. We believe that the operating
components of pension costs better refl ect the ongoing service-
related costs of providing pension benefi ts to our employees.
We believe that the operating and non-operating components
of cost for our principal pension plans, considered along with the
corresponding GAAP measure, provide management and inves-
tors with additional information for comparison of our pension
plan costs and operating results with the pension plan costs and
operating results of other companies.