GE 2013 Annual Report Download - page 131
Download and view the complete annual report
Please find page 131 of the 2013 GE annual report below. You can navigate through the pages in the report by either clicking on the pages listed below, or by using the keyword search tool below to find specific information within the annual report.-
 1
1 -
2
-
3
-
4
-
5
-
6
-
7
-
8
-
9
-
10
-
11
-
12
-
13
-
14
-
15
-
16
-
17
-
18
-
19
-
20
-
21
-
22
-
23
-
24
-
25
-
26
-
27
-
28
-
29
-
30
-
31
-
32
-
33
-
34
-
35
-
36
-
37
-
38
-
39
-
40
-
41
-
42
-
43
-
44
-
45
-
46
-
47
-
48
-
49
-
50
-
51
-
52
-
53
-
54
-
55
-
56
-
57
-
58
-
59
-
60
-
61
-
62
-
63
-
64
-
65
-
66
-
67
-
68
-
69
-
70
-
71
-
72
-
73
-
74
-
75
-
76
-
77
-
78
-
79
-
80
-
81
-
82
-
83
-
84
-
85
-
86
-
87
-
88
-
89
-
90
-
91
-
92
-
93
-
94
-
95
-
96
-
97
-
98
-
99
-
100
-
101
-
102
-
103
-
104
-
105
-
106
-
107
-
108
-
109
-
110
-
111
-
112
-
113
-
114
-
115
-
116
-
117
-
118
-
119
-
120
-
 121
121 -
 122
122 -
 123
123 -
 124
124 -
 125
125 -
 126
126 -
 127
127 -
 128
128 -
 129
129 -
 130
130 -
 131
131 -
 132
132 -
 133
133 -
 134
134 -
 135
135 -
 136
136 -
 137
137 -
 138
138 -
 139
139 -
 140
140 -
 141
141 -
142
-
143
-
144
-
145
-
146
-
147
-
148
-
149
-
150
 |
 |

GE 2013 ANNUAL REPORT 129
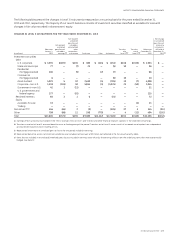
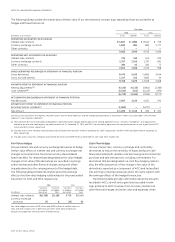
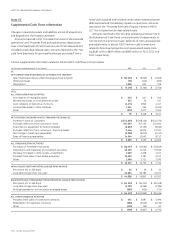
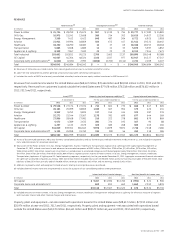
reclassifi ed out of AOCI, for the years ended December 31, 2013
and 2012, respectively. See Note 15 for additional information
about reclassifi cations out of AOCI.
Gain (loss)
recognized in AOCI
Gain (loss) reclassified
from AOCI into earnings
(In millions) 2013 2012 2013 2012
Interest rate contracts $ (26) $ (158) $ (364) $ (499)
Currency exchange
contracts 941 1,004 817 681
Commodity contracts (6) 6 (5) (5)
Total $ 909 $ 852 $ 448 $ 177
The total pre-tax amount in AOCI related to cash flow hedges of forecasted
transactions was a $251 million loss at December 31, 2013. We expect to transfer
$208 million to earnings as an expense in the next 12 months contemporaneously
with the earnings effects of the related forecasted transactions. In 2013, we
recognized insignificant gains and losses related to hedged forecasted transactions
and firm commitments that did not occur by the end of the originally specified
period. At December 31, 2013 and 2012, the maximum term of derivative
instruments that hedge forecasted transactions was 19 years and 20 years,
respectively.
For cash fl ow hedges, the amount of ineffectiveness in the hedg-
ing relationship and amount of the changes in fair value of the
derivatives that are not included in the measurement of inef-
fectiveness are both refl ected in earnings each reporting period.
These amounts are primarily reported in GECC revenues from
services and totaled $0 million and $5 million for the years ended
December 31, 2013 and 2012, respectively.
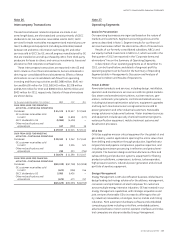
Net Investment Hedges in Foreign Operations
We use currency exchange derivatives to protect our net
investments in global operations conducted in non-U.S. dollar
currencies. For derivatives that are designated as hedges of net
investment in a foreign operation, we assess effectiveness based
on changes in spot currency exchange rates. Changes in spot
rates on the derivative are recorded as a component of AOCI until
such time as the foreign entity is substantially liquidated or sold.
The change in fair value of the forward points, which refl ects the
interest rate differential between the two countries on the deriva-
tive, is excluded from the effectiveness assessment.
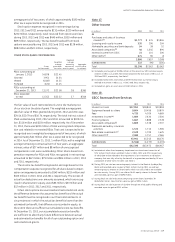
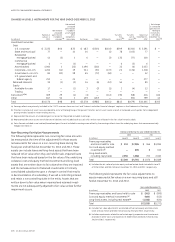
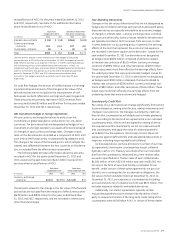
The following table provides information about the amounts
recorded in AOCI for the years ended December 31, 2013 and
2012, as well as the gain (loss) recorded in GECC revenues from
services when reclassifi ed out of AOCI.
Gain (loss)
recognized in CTA
Gain (loss)
reclassified from CTA
(In millions) 2013 2012 2013 2012
Currency exchange
contracts $ 2,322 $ (2,905) $ (1,525) $ 27
The amounts related to the change in the fair value of the forward
points that are excluded from the measure of effectiveness were
$(678) million and $(874) million for the years ended December
31, 2013 and 2012, respectively, and are recorded in interest and
other fi nancial charges.
Free-Standing Derivatives
Changes in the fair value of derivatives that are not designated as
hedges are recorded in earnings each period. As discussed above,
these derivatives are typically entered into as economic hedges
of changes in interest rates, currency exchange rates, commod-
ity prices and other risks. Gains or losses related to the derivative
are typically recorded in GECC revenues from services or other
income, based on our accounting policy. In general, the earnings
effects of the item that represent the economic risk exposure
are recorded in the same caption as the derivative. Losses for the
year ended December 31, 2013 on derivatives not designated
as hedges were $(449) million composed of amounts related
to interest rate contracts of $(111) million, currency exchange
contracts of $(595) million, and other derivatives of $257 million.
These losses were more than offset by the earnings effects from
the underlying items that were economically hedged. Losses for
the year ended December 31, 2012 on derivatives not designated
as hedges were $(90) million composed of amounts related to
interest rate contracts of $(296) million, currency exchange con-
tracts of $80 million, and other derivatives of $126 million. These
losses were more than offset by the earnings effects from the
underlying items that were economically hedged.
Counterparty Credit Risk
Fair values of our derivatives can change signifi cantly from period
to period based on, among other factors, market movements and
changes in our positions. We manage counterparty credit risk
(the risk that counterparties will default and not make payments
to us according to the terms of our agreements) on an individual
counterparty basis. Where we have agreed to netting of deriva-
tive exposures with a counterparty, we net our exposures with
that counterparty and apply the value of collateral posted to
us to determine the exposure. We actively monitor these net
exposures against defi ned limits and take appropriate actions in
response, including requiring additional collateral.
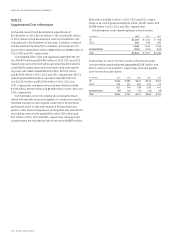
As discussed above, we have provisions in certain of our mas-
ter agreements that require counterparties to post collateral
(typically, cash or U.S. Treasury securities) when our receivable
due from the counterparty, measured at current market value,
exceeds a specifi ed limit. The fair value of such collateral was
$4,581 million, of which $2,619 million was cash and $1,962 mil-
lion was in the form of securities held by a custodian for our
benefi t. Under certain of these same agreements, we post col-
lateral to our counterparties for our derivative obligations, the
fair value of which was $242 million at December 31, 2013. At
December 31, 2013, our exposure to counterparties (including
accrued interest), net of collateral we hold, was $871 million. This
excludes exposure related to embedded derivatives.
Additionally, our master agreements typically contain
mutual downgrade provisions that provide the ability of each
party to require termination if the long-term credit rating of the
counterparty were to fall below A-/A3. In certain of these master